Almost one-quarter of U.S. homebuyers purchase properties outside of their local metro areas
For U.S. homebuyers, affordability, job opportunities and outdoor amenities largely drive relocation choices. A previous CoreLogic analysis showed that homebuyers who relocated to another metro area in the previous year often migrated to areas that were either adjacent to their current location, had a lower cost of living or both.
However, as more employees return to offices, the combination of higher home prices, elevated interest rates and uncertain economic conditions might influence potential homebuyers’ purchasing decisions in 2023. This, in turn, could impact their choice of location and influence U.S. migration patterns.
This analysis uses CoreLogic loan application data to highlight owner-occupied homeowner mobility and migration trends recorded so far in 2023 (January through September). It examines metro areas with the most in- and out-migration of potential homebuyers and how these U.S. migration patterns compare with the previous four years. [1]
Out-of-Metro Home Loan Application Share Rises in 2023
CoreLogic data shows that the share of out-of-metro applicants increased from the pre-pandemic rate of 16% in 2019 to 23% in 2023 (Figure 1). Among potential homebuyers, the overwhelming majority (77%) still prefer to purchase properties within the same general area.

OUT/IN Ratios for Top 15 Metros With the Highest Outbound Loan Applications
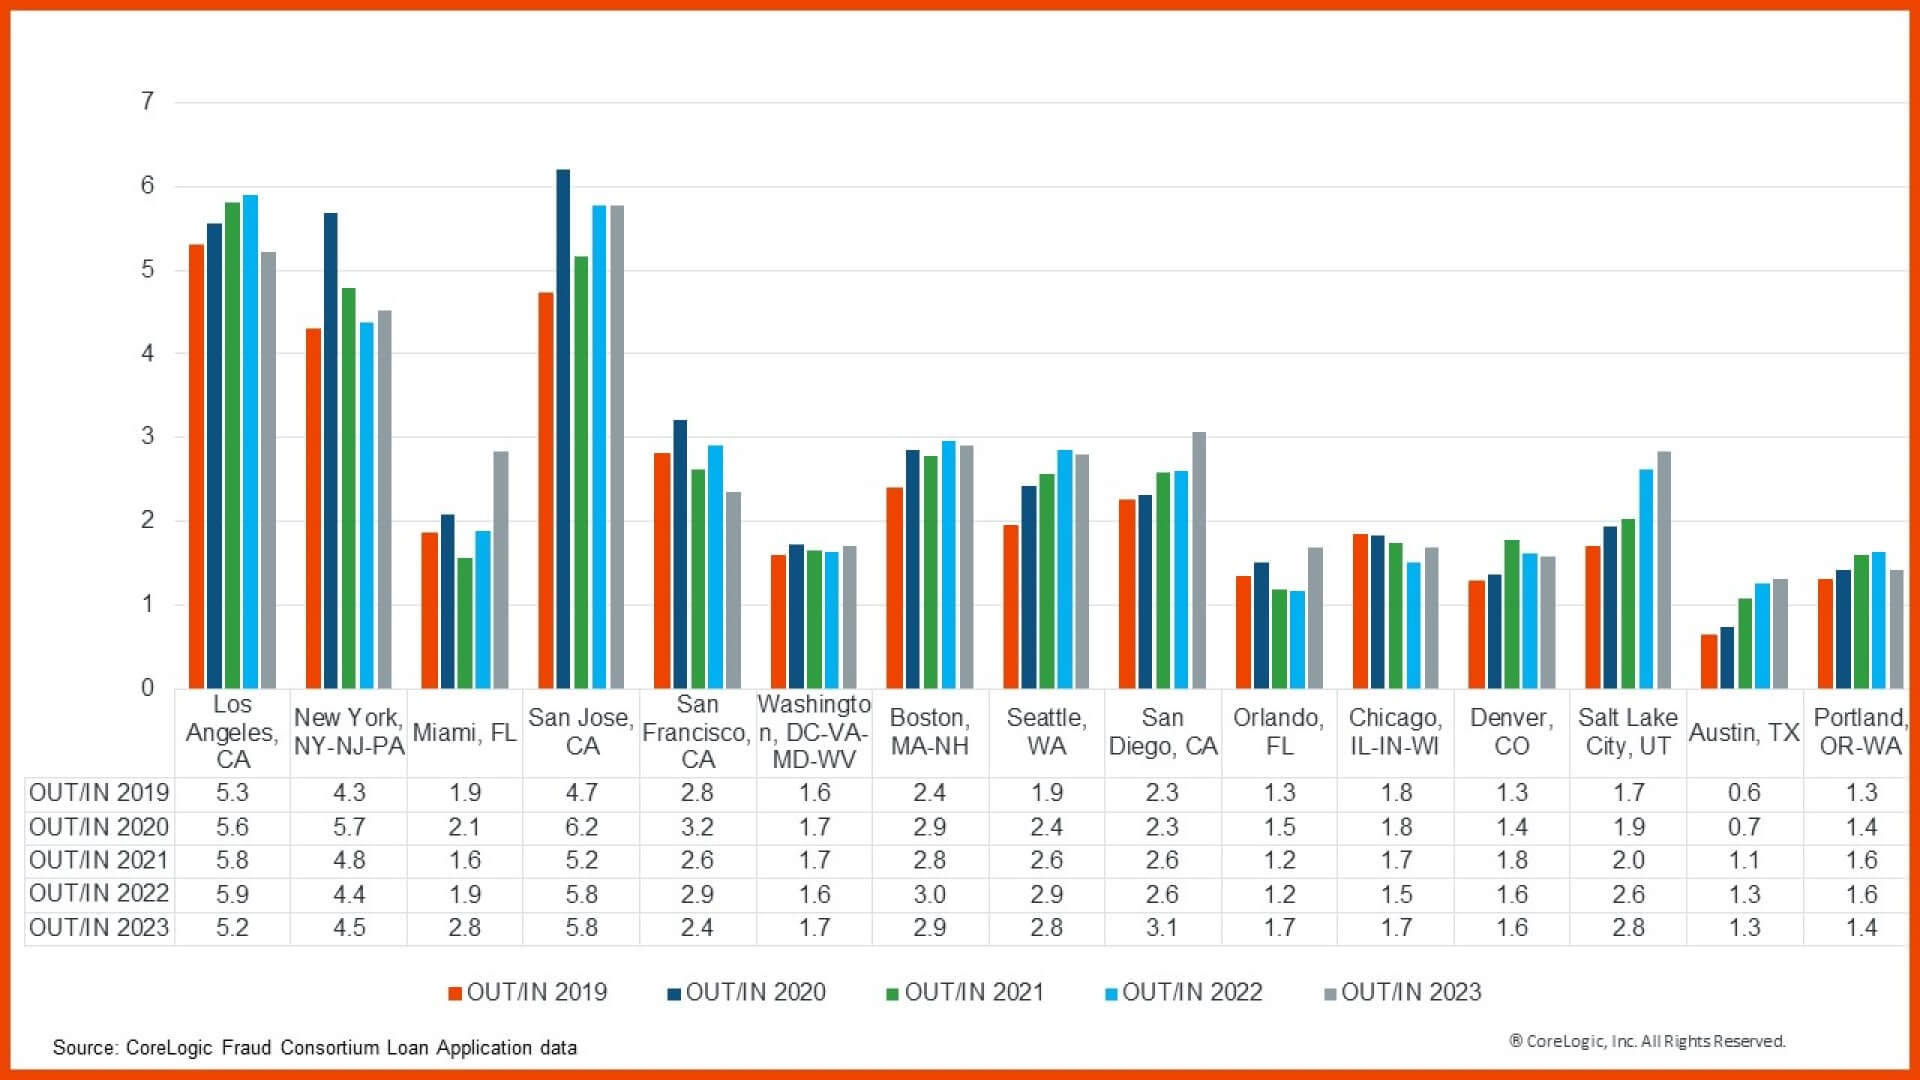
Figure 2 shows the movement ratio for the top 15 metros with the highest out-migration loan application activity. [2] The out-migration/in-migration (OUT/IN) ratio for most of these metros has remained about the same in 2023 compared with previous years.
However, the ratio in Miami rose from 1.9 in 2022 to 2.8 in 2023, which indicates that more residents are moving away from Miami than did so last year. Also, Orlando, Florida made its way into the list of top 15 metros with the highest out-migration loan activity, signifying an increase in the number of homebuyers leaving that metro in 2023 compared with previous years. Likewise, though more people moved to Austin, Texas than left in 2019 and 2020, that trend flipped in 2021 and has continued through 2023, as that metro is becoming increasingly less affordable.
The metros in Figure 2 are sorted from left to right based on their net out-migration in 2023, with Los Angeles experiencing the highest net out-migration among all areas so far.[3] New York has seen the second-highest level of out migration in 2023, followed by Miami and San Jose, California.
Still, while Los Angeles ranks as the top out-migration metro, the OUT/IN ratio has declined slightly so far in 2023 suggesting that fewer homebuyers moved relative to those who arrived compared with 2022. In Miami, the ratio of buyers moving out compared with buyers who are arriving in the region has so far jumped in 2023.[4]

IN/OUT Ratios for Top 15 Metros With Highest Inbound Loan Applications
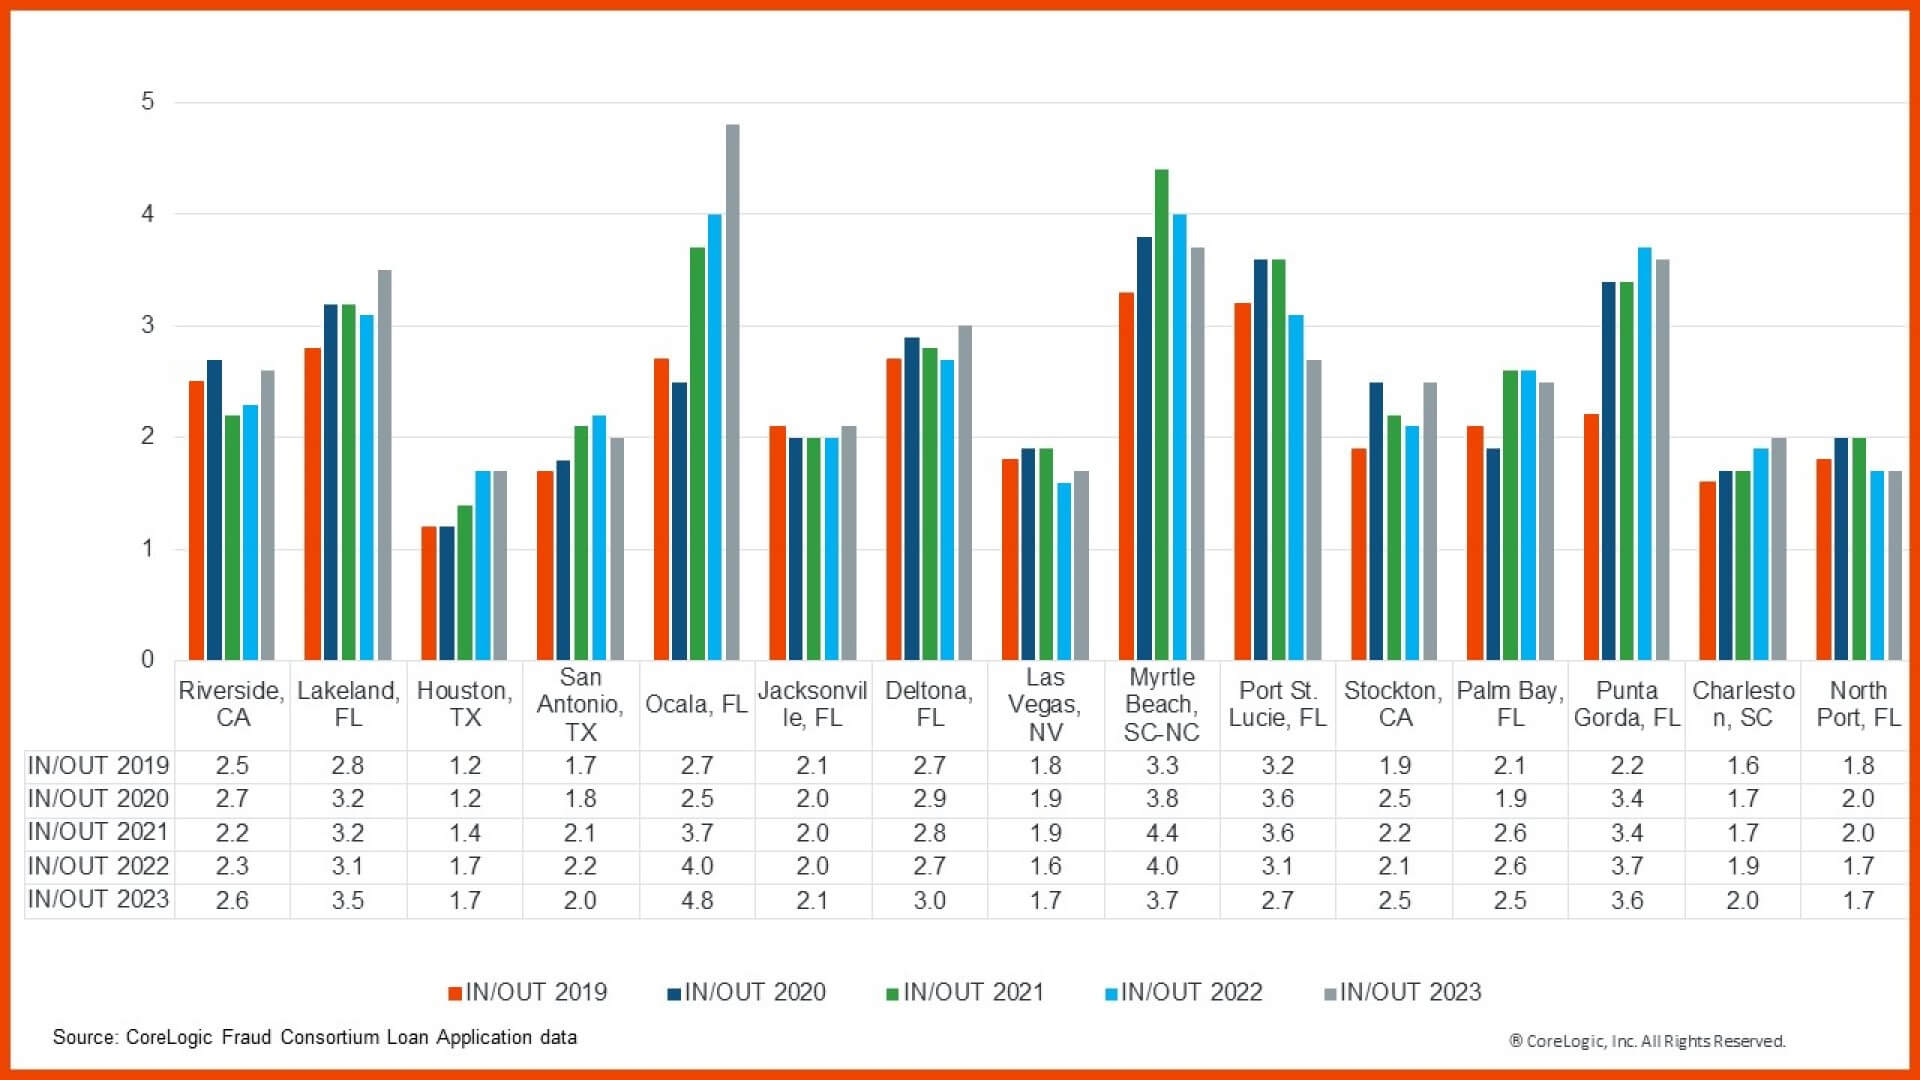
Likewise, Figure 3 shows that the in-migration/out-migration (IN/OUT) ratios for the top 15 metros with the highest in-migration mortgage loan application activity. With a few exceptions, these metros are more affordable compared with the ones shown in Figure 2.
For instance, Riverside, California and Stockton, California may not be considered affordable on a national scale, but they are significantly more affordable than other major coastal metros in the state. Notably, Los Angeles and San Diego counties saw a net loss of potential homebuyers who moved to neighboring Riverside.
Figure 3 displays metros from left to right by net in-migration in 2023, meaning that more people moved to these metros than moved out. Riverside led the pack in terms of in-migration activity, followed by Lakeland, Florida; and the Texas cities of Houston and San Antonio.

Examining Inter-Metro Potential Homebuyer U.S. Migration Patterns
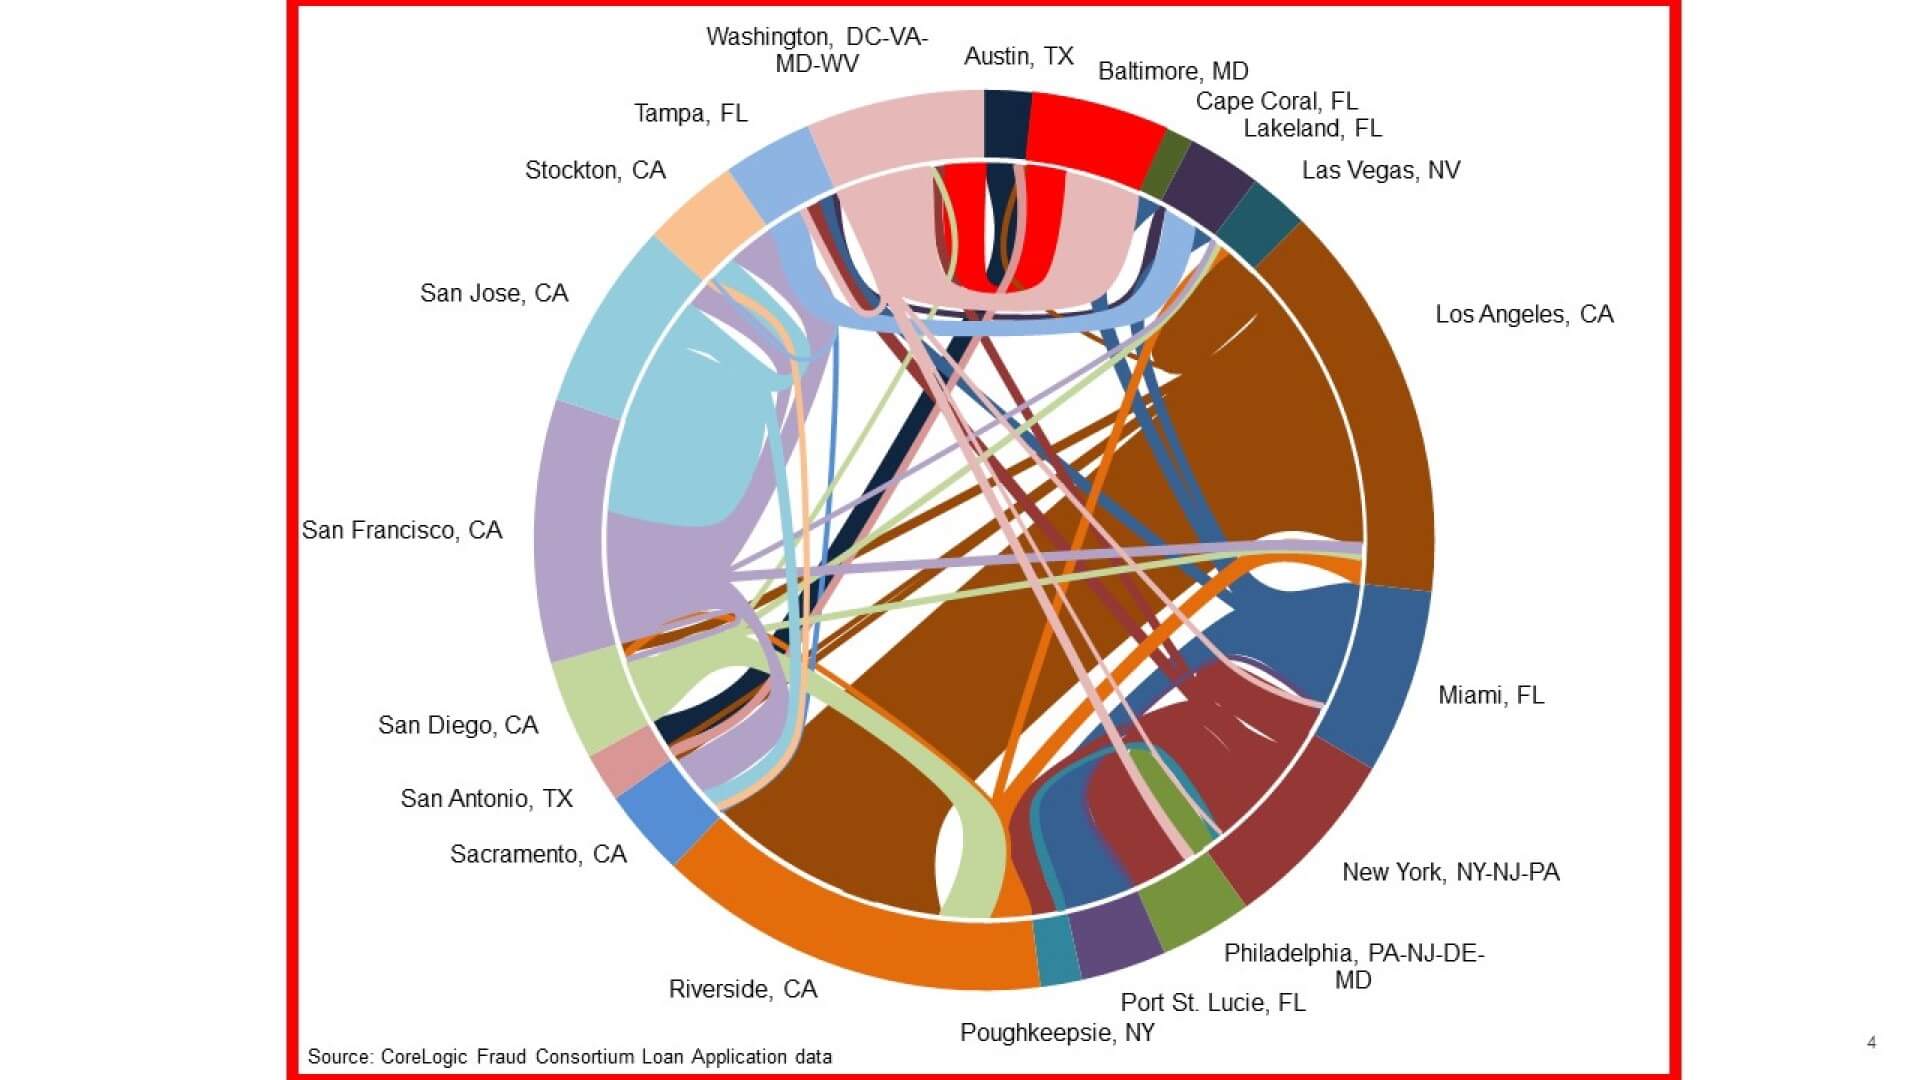
Figure 4 tracks the inter-metro migration trends of potential homebuyers in select top metros as sources or destinations of moves in 2023. Individual chords show migration between metros, with colors matching the origin metro.
In California, higher-cost metros, such as Los Angeles, San Jose and San Francisco saw applicants migrate to more affordable neighboring metros. As previously mentioned, the Los Angeles and San Diego metros saw more potential homebuyers migrate to Riverside.
Similarly, on the East Coast, the New York metro has seen potential homebuyers relocate to more affordable regional metros, such as Philadelphia; Poughkeepsie, New York; Allentown, Pennsylvania; and Bridgeport, Connecticut. However, warmer-weather metros, such as Miami; Atlanta; Charlotte, North Carolina; and Tampa, Florida are also destinations[5]. Surprisingly, it’s not just the high-cost metros that lost mortgage applicants; this trend also extends to more affordable U.S. areas.
While Miami has attracted some applicants from high-cost areas such as New York and Washington, D.C., South Floridians seem to be moving to more cost-friendly regional areas such as Port St. Lucie, Cape Coral, Jacksonville and Lakeland.[5] Underscoring this point is that a significant number of Tampa residents moved to Lakeland, which is a more affordable housing market less than 40 miles away.

Homebuyers continue to seek more affordable metros near their current residences, a U.S. migration pattern that was observed in previous years and has persisted both during and after the pandemic. The flexibility of remote work has reduced the need to live close to one’s employer, enabling homebuyers to broaden their search.
Affordability and other amenities have accelerated homebuyer migration rates. As home affordability continues to worsen, it is likely to see more purchases in relatively less-expensive housing markets in the coming years.
CoreLogic’s team of expert economists regularly weighs in on the latest housing market data, news and trends in analyses that can always be found at the Office of the Chief Economist’s home page.
[1] The analysis is based on all home purchase mortgage applications, accepted or not, from January 2023 through September 2023 and compared with the last four years (applications from January 2019 to December 2022). Investors and second-home buyers are excluded from this analysis. The metros are analyzed at Core-Based Statistical Area (CBSA) levels.
[2] The OUT/IN ratio represents the number of applications by residents to buy outside the metro they currently live in relative to the number of out-of-metro applications to buy in that area. For example, a ratio of 6 for Los Angeles means that there were six households attempting to buy outside of Los Angeles for every out-of-Los Angeles resident buying in the metro.
[3] Net out-migration is the difference between number of outgoing minus the number of incoming homebuyers.
[4] Miami ranked eighth in terms of net out-migration among all the metros in 2022.
[5] Allentown, Atlanta, Bridgeport, Charlotte and Jacksonville are not shown in Figure 4.


