Migration of coastal residents with larger budgets to affordable metros keeps pushing home price growth higher
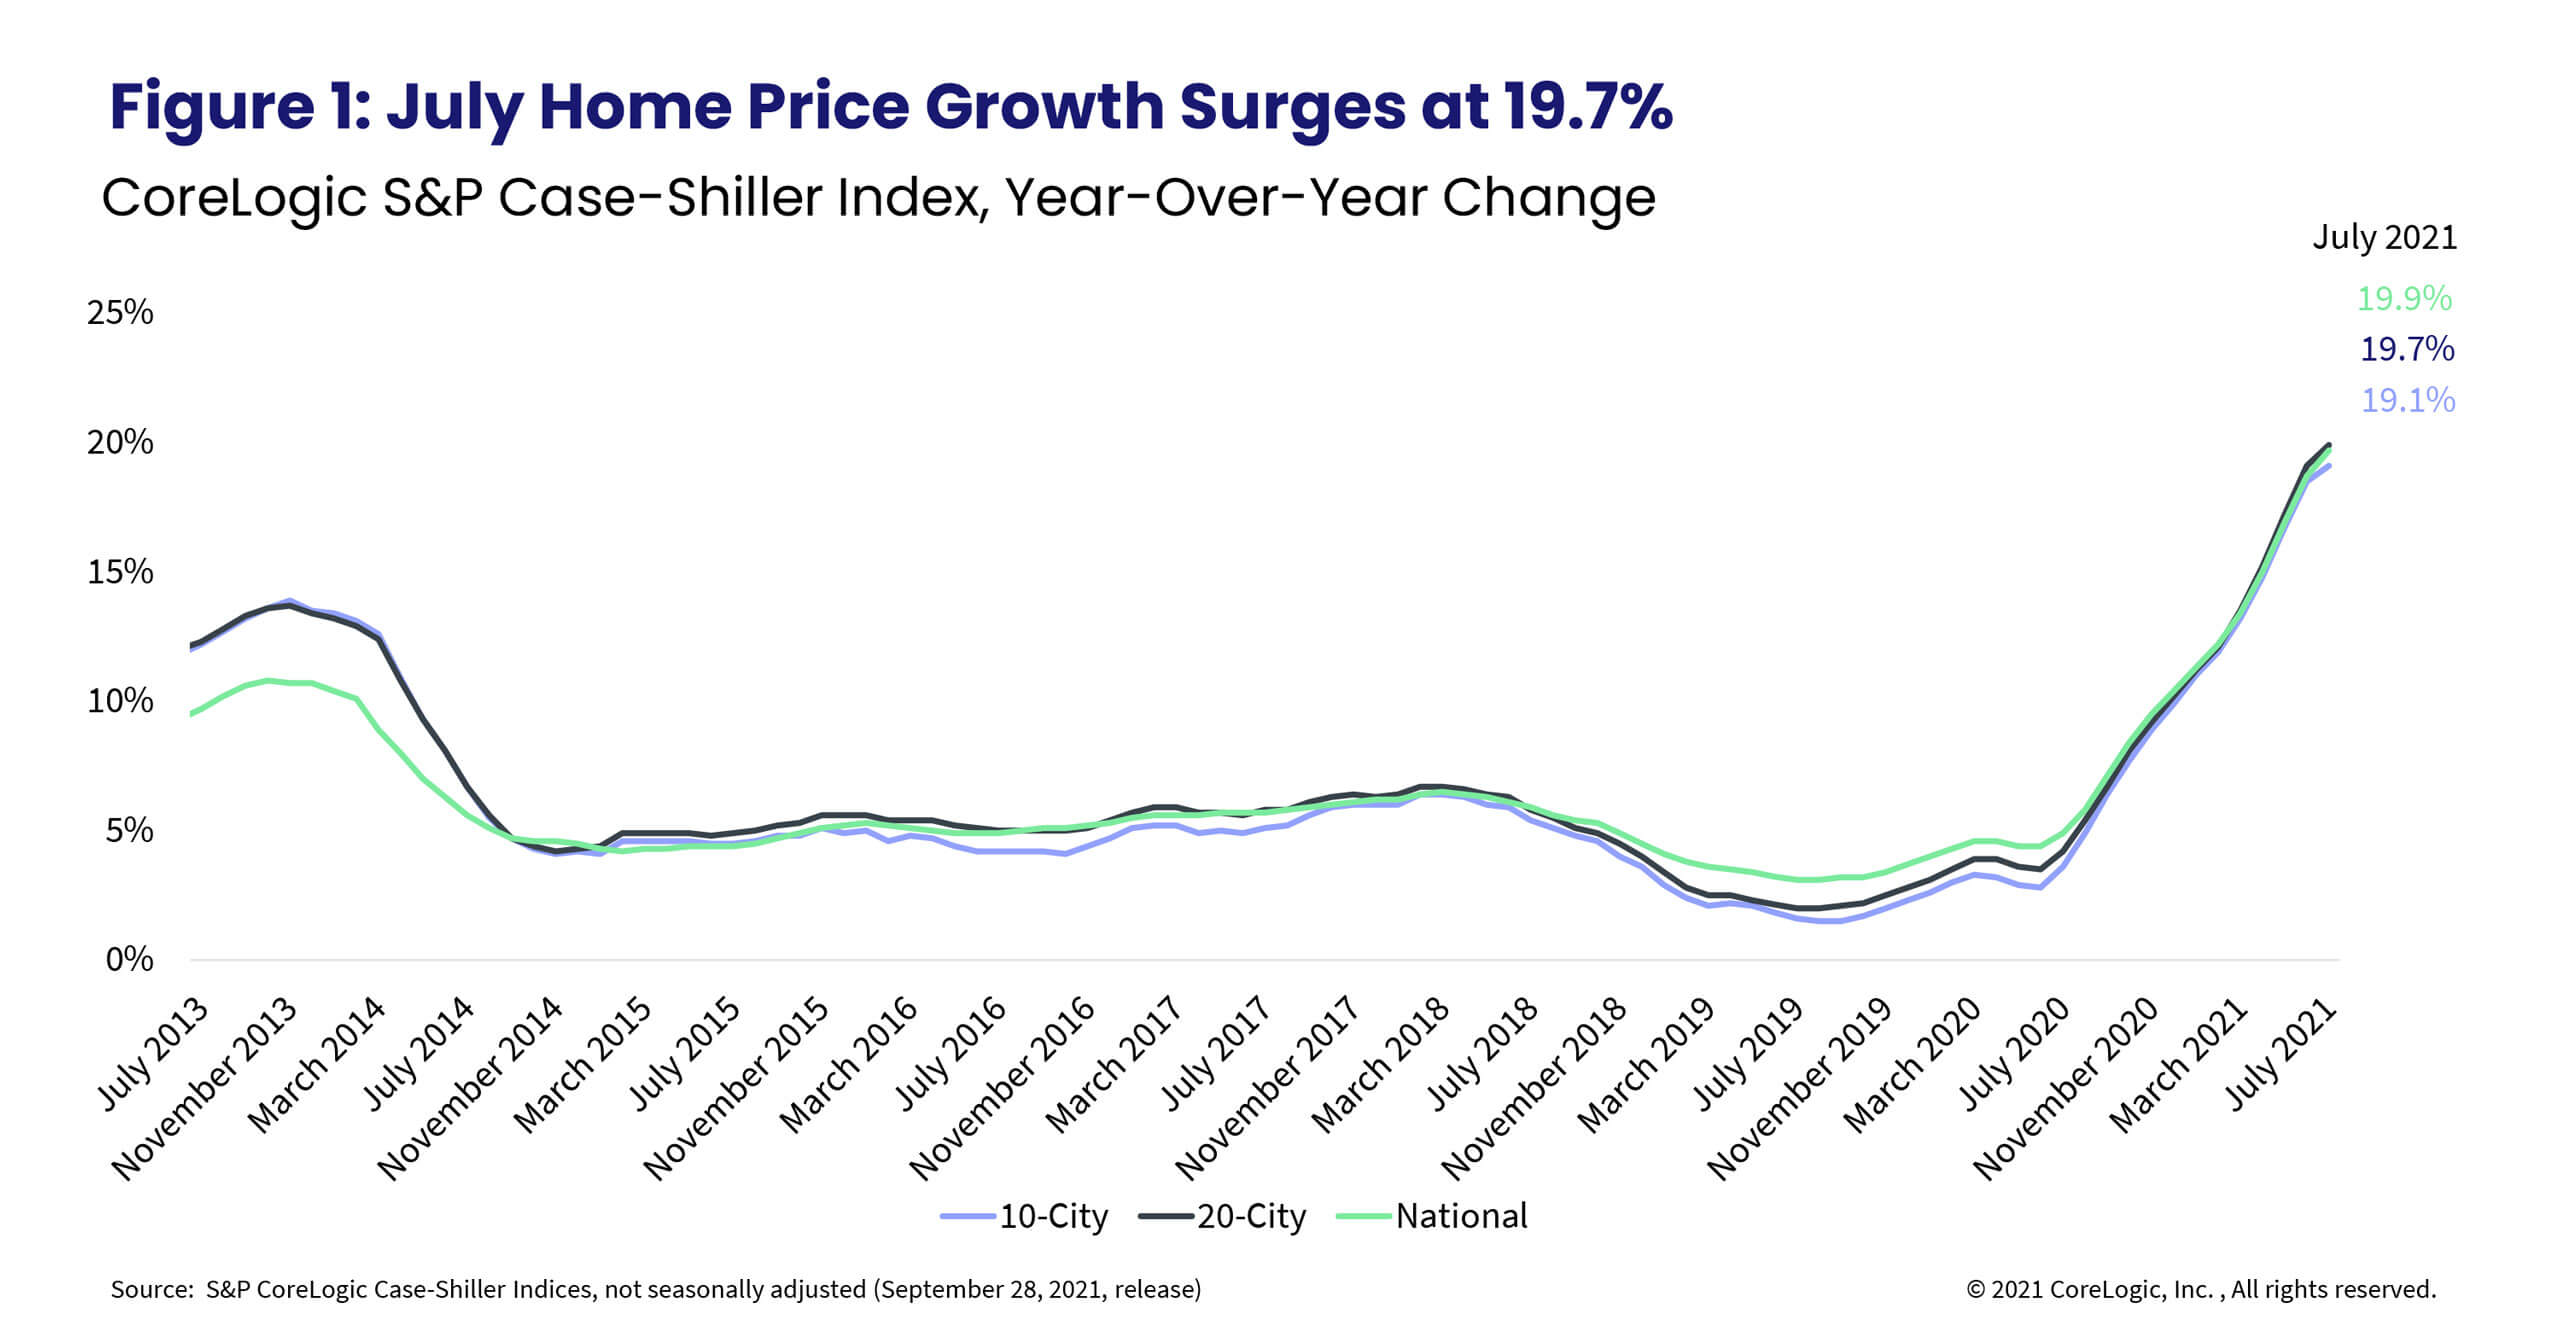
Summer’s red-hot housing markets are echoed in the latest S&P CoreLogic Case-Shiller Index, which accelerated to a new record high — up 19.7% year over year. The month-to-month index, up 1.62%, showed persistence in monthly increases and also accelerated at the fastest June-to-July rate since the inception of the data series.
There’s a surge of millennials approaching the prime home-buying age and are experiencing more flexibility to expand their search locations. Additionally, there are move-up buyers with larger budgets who are relocating to more affordable areas where they’re financially able to outbid local residents. Taken together, these factors have created a double whammy for home price growth. Homebuyers across all ages continue to enjoy historically low mortgage rates but have now also been joined by an influx of investor buyers over the summer. This continued high buyer demand has even outstripped the improvements in the supply of for-sale homes from the all-time lows experienced in the spring.
Market heat indicators, such as days on market, share of homes selling over the asking price and sale price premiums, all pointed to no sign of relief over the summer. By the end of the season, some indicators suggested the housing market might cool, but not more than seasonally expected. Still, buyer fatigue is likely to set in and take some wind out of the fierce market competition which will likely lead to home price growth slowing.
The 10- and 20-city composite indexes also maintained the momentum, up 19.1% and 19.9% year over year, respectively. This is the fastest growth rate for the 10-city index since 2004 while the 20-city index has never recorded such a strong home price increase (Figure 1). The faster acceleration of the 20-city index compared to the 10-city index illustrates the rapid price growth seen in smaller, more affordable metros where in-migration from coastal residents has been pushing home price growth to new highs. Compared to the 2006 peak, the 10-city composite is now 26% higher, while the 20-city composite is 32% higher.

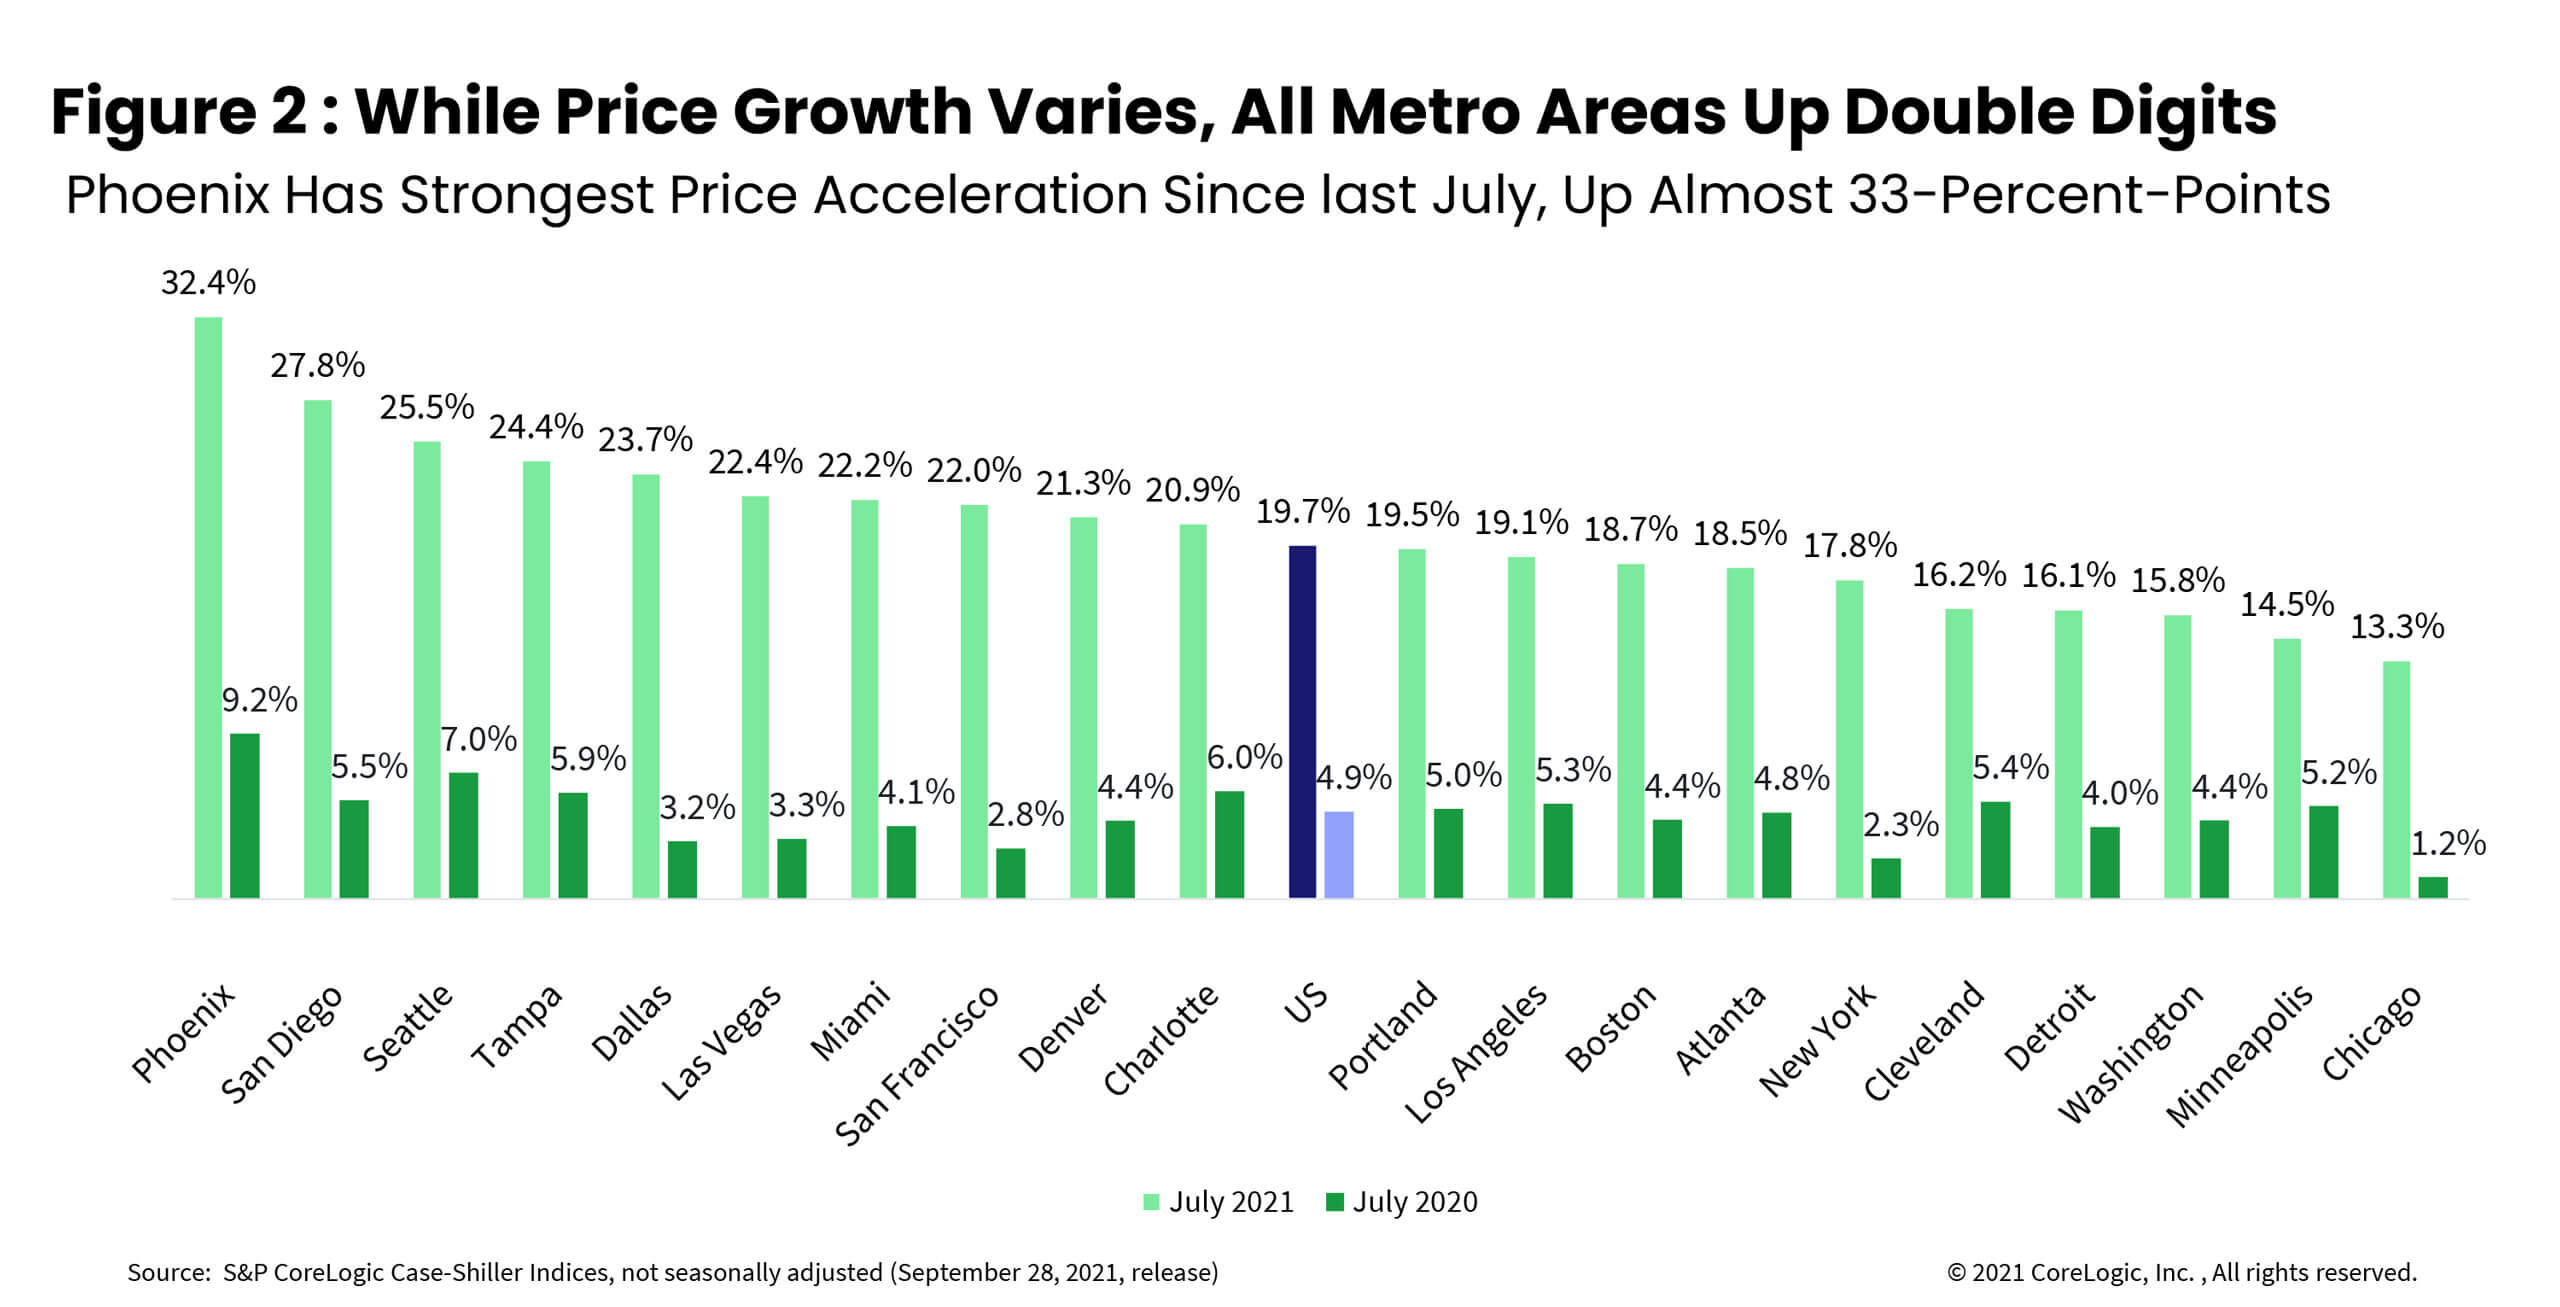
For the 25th consecutive month, Phoenix maintained the strongest home price growth among the 20 markets, surging 32.4% in July, the fastest acceleration since the spring of 2006 and 23-percentage points higher than last July’s growth. There has been very little change in the ranking of metropolitan areas by price growth over the last year.
San Diego remained in second place for the strongest home price growth, with an annual acceleration of 27.8%, and a larger jump of over 22-percentage points from last July. Seattle, in third place, had a 25.5% jump in July.
Chicago (up 13.3%) and Minneapolis (up 14.5%) continued to lag despite both experiencing double-digit growth. Chicago has been ranking the lowest in price appreciation in the past five months’ releases with no change in price growth compared to June. However, Minneapolis had the slowest acceleration in price growth compared to last year (Figure 2).

In July, national home prices were 44% higher than the previous peak. All metros are now at or above their previous peaks. Chicago has finally caught up with its previous peak while Denver’s prices have leapt 102% above its 2006 peak, followed by Dallas at 94% (Figure 3). Nonetheless, while nominal prices have surpassed previous levels, national home prices are only 10% above the previous peak when adjusted for inflation.

The low tier and high tier home price growth converged in July with both tiers recording 21.2% annual growth. However, the middle tier recorded a somewhat smaller 20.7% year-over-year increase. This convergence occurred as demand for homes in all price segments remains strong, and is particularly due to heightened demand for higher-end homes since last summer and continued competition for entry-level homes in the low tier. The demand for homes in the low tier is again bolstered by an influx of investors whose activity surged during the spring months and remains elevated. Also, note that high tier price growth is at the highest rate recorded in the data.
Lastly, the month-to-month changes in home price growth by price tier and location reveal the recent relative desirability of metro areas and purchase power of the buyers.
The largest home price increase in the lower one-third price tier remains in Phoenix, up 4% from June to July, followed by Atlanta at 2.8% and Las Vegas and Miami both at 2.6%. Compared to monthly growth rates recorded in April, Miami, Phoenix and Atlanta have had the strongest acceleration among low price tiers.
In the high tier, Phoenix was in the lead with a 3.2% increase followed by a 2.9% increase in Tampa, Florida, and Las Vegas. The Washington metro has experienced some weakening in monthly acceleration rates compared to earlier in the year, and among metros within the high tier, it ranks the lowest for monthly growth rates.
Interestingly, in Las Vegas and San Diego, the high tier is accelerating at a faster pace than lower tiers as again, an influx of buyers with larger budgets keep propping demand for higher-end homes .
In summary, this summer seemed to mark a peak of home buying activity not seen since the pre-Great Recession. Nevertheless, while it may naturally be worrisome to see the same type of home buyer frenzy as the time leading up to the Great Recession, there are many different circumstances to keep in mind. The current rapid rise in home price appreciation appears to be driven by different mobility opportunities not necessarily seen pre-Great Recession. Namely, with being able to work from home, households from expensive coastal areas are moving to more affordable places and also bringing with them higher price expectations that they are willing to pay. As a result, larger budgets of incoming residents are pushing home price growth beyond rates previously recorded. While the continued price growth may seem unsustainable, continued migration from pricier coastal areas may continue pushing home price growth higher. Still, with inventories likely seeing some respite and buyer fatigue, acceleration is likely to take a step back by the end of this year but remain in double digits through the remainder of 2021.
©2021 CoreLogic, Inc. , All rights reserved.


