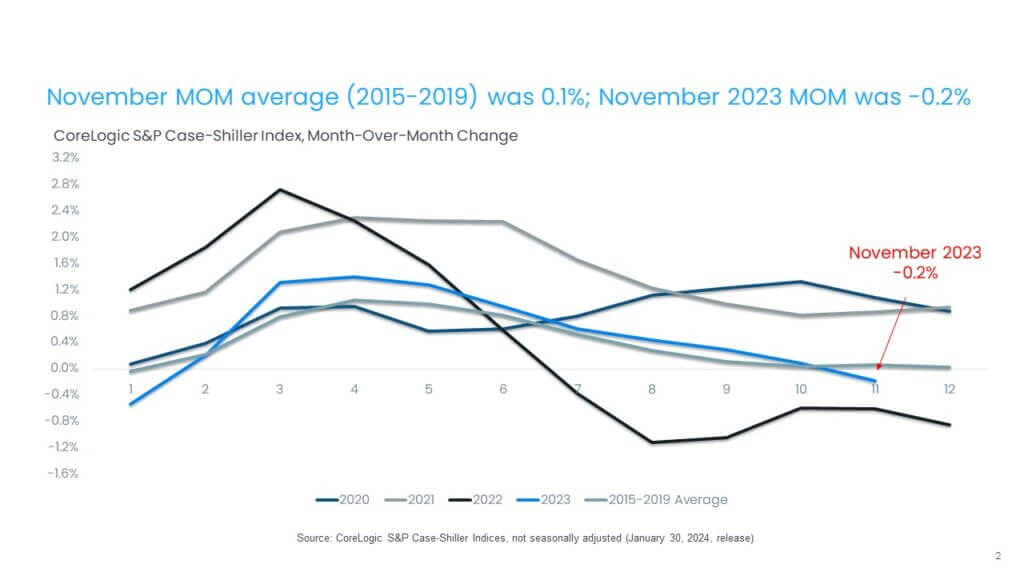
While solid annual gains reflect comparisons to a weak 2022 winter, high mortgage rates began impacting seasonal appreciation in November, bringing prices down from 0.2% in October
The prospect for 2024 housing market activity appeared more optimistic following December’s Federal Reserve meeting, which indicated the end of a tightening cycle. After that event, mortgage rates slid from 8% to 6.6%. Nevertheless, with mortgage rates remaining in that general range since the meeting, it is not clear that additional relief will arrive in time for the spring homebuying season. However, it is encouraging that 2024 has begun with more new listings relative to last year, leading some homebuyers to again step off the sidelines.
And while overall home sales activity is expected to pick up throughout 2024, that increase could be thwarted by a continued shortage of inventory. On the other hand, pent-up buyer demand will continue to outweigh available supply and drive home prices higher. CoreLogic’s November Home Price Index (HPI) forecast estimates that home prices will increase by another 3% on average in 2024.
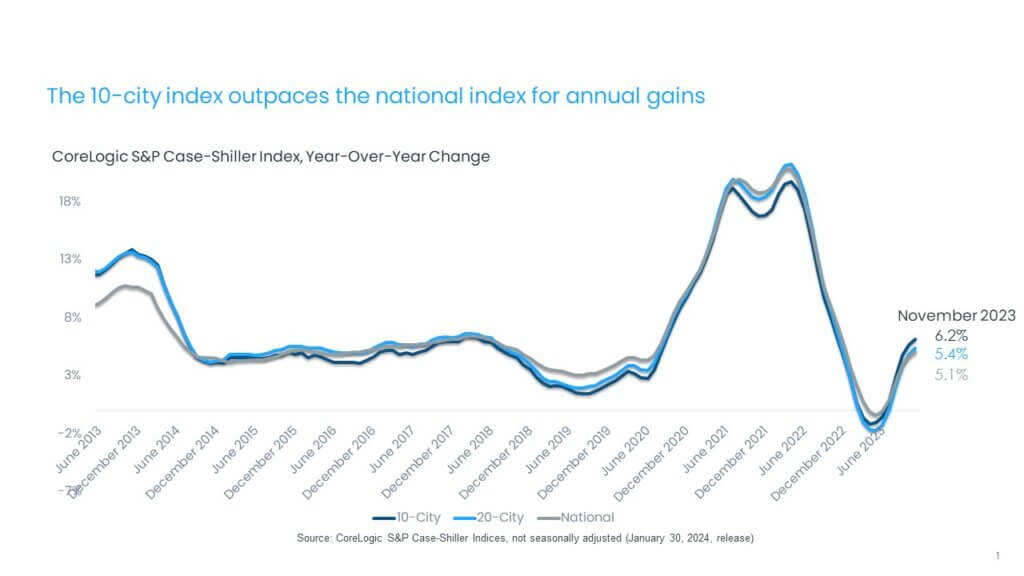
In November, the CoreLogic S&P Case-Shiller Index rose by 5.1% year over year, the fifth month of annual increases following two months of annual declines (Figure 1). With the rebound in appreciation this year, home prices are now up by 1.3% compared with the June 2022 peak and up by 6.6% from the January 2023 bottom.
On the other hand, high mortgage rates affected monthly price gains, with the non-seasonally adjusted month-over-month index declining for the first time since January 2023, down by 0.2% in November, compared with the seasonal average increase of 0.1% recorded between 2015 and 2019 (Figure 2).
The 10-city and 20-city composite indexes posted the fifth month of annual increases in November, up by 6.2% and 5.4%, respectively. Both indexes are also up by 7.5% and 7%, respectively, since the beginning of 2023. The 10-city index includes currently better-performing metro areas such as New York and Chicago, which have seen relatively stronger housing markets since mid-2022, as the return to cities and offices continues. Many of these metros are catching up on home prices gains that pandemic-era boomtowns experienced during COVID-19. The metros with the strongest gains since the beginning of the year include Detroit, up by 10%; San Diego, up by 9.9%; and Chicago, up by 8.8%.
Compared with the 2006 peak, the 10-city composite index is now 47% higher, while the 20-city composite is up by 54%. Adjusted for inflation, which is showing signs of easing, the 10-city index is now 1% higher than its 2006 level, while the 20-city index is up by 6% compared with its 2006 high point. Nationally, home prices are 16% higher (adjusted for inflation) compared with 2006.
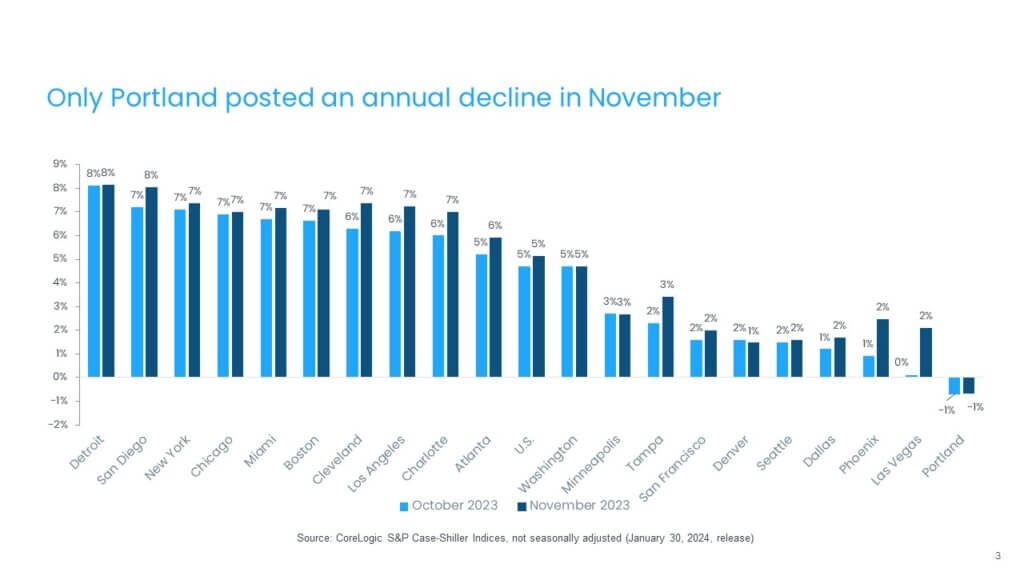
In November, 15 metros saw faster price growth year over year, while five metros saw slowing or no change in annual gains (Figure 3). Detroit and San Diego again led the 20-city index, with respective annual gains of 8.1% and 8%; followed by New York and Cleveland, both up by 7.4%.
However, the strongest month-over-month price acceleration from was again seen in the Western U.S., particularly in Las Vegas, Phoenix, and Los Angeles. Only Portland, Oregon continued to record annual declines, down by 0.7% year-over-year.
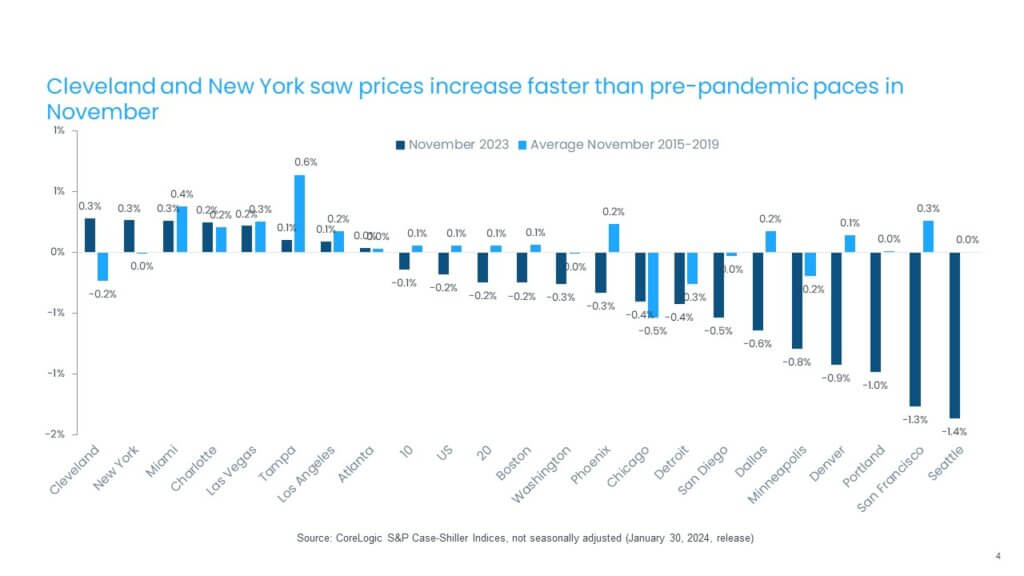
While home prices declined by 0.2% nationally from October to November, regional variances continued. Figure 4 summarizes the current year’s monthly changes in November compared with averages recorded between 2015 and 2019.
Detroit and New York posted the nation’s largest monthly gains, both at 0.3%. Detroit continues to see a strong uptick in home prices gains, which were declining prior to the pandemic at this time of the year. Other metros with strong monthly gains are in the West – including Las Vegas and Los Angeles – as well as markets in the Southeast, such as Miami; Tampa, Florida and Charlotte, North Carolina. Generally, many of the markets that experienced home price declines in 2022 or lagged in appreciation during the pandemic are now topping the list of high-price-growth metros. In contrast, Seattle, San Francisco, Portland, Denver and Minneapolis saw prices weaken in November, though mostly along the pre-pandemic seasonal average trends (Figure 4).
Across price tiers, the low tier showed a relatively stronger rebound in November, with a 5.4% annual increase. The strength in low tier continues to reflect shortages in the U.S. housing supply, particularly for smaller and more affordable homes, which have been in high demand due to surging homeownership costs and competing demand from investors that continue to be active despite higher mortgage rates. And while the high tier led price gains during the pandemic, the slowing migration of higher-income households, as well as volatility in financial markets during 2023, dampened price gains at that point.
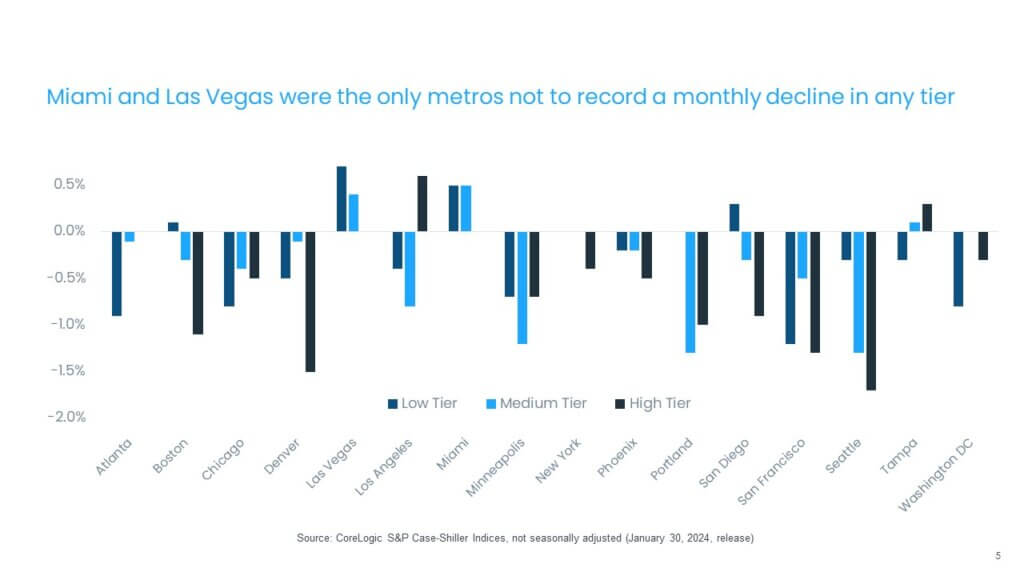
The month-over-month comparison of appreciation by price tier and location also reveals relative changes in demand across the country. In November, most metros and price tiers saw home prices fall. The largest slowdown was in the high tier in Seattle, San Francisco and Denver. Only Las Vegas and Miami generally saw home prices continue to pick up in the low and middle tiers (Figure 5).
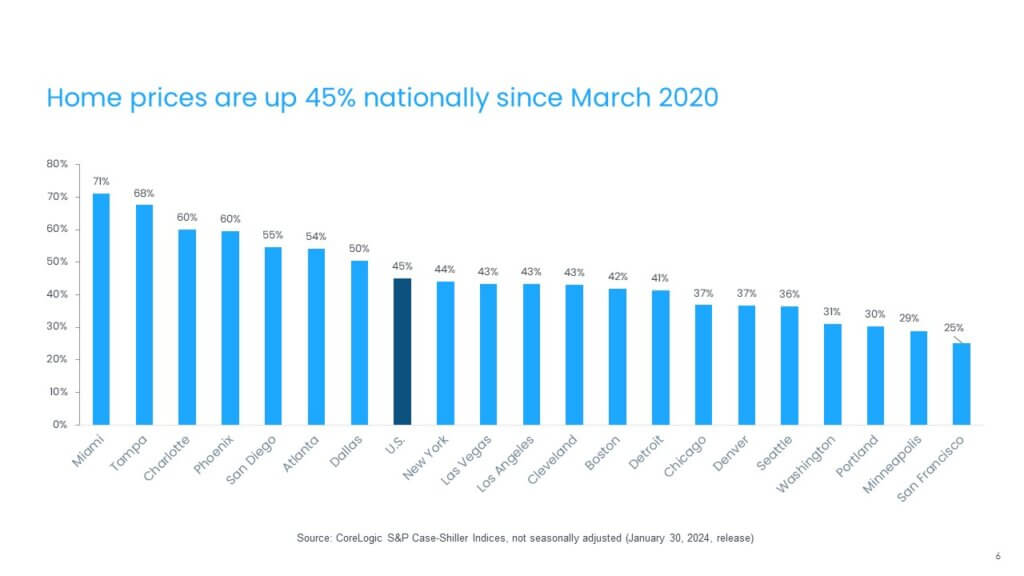
Lastly, while Midwestern and Western areas dominate some of the recent top-appreciating housing markets, the largest cumulative gains in home prices remain in the markets in South and Southeast. Figure 6 illustrates total home gains since March 2020. Miami and Tampa, Florida rank at the top, both posting about 70% of total home price increases compared with the national average of 45%.
As 2024 kicks off, we are likely to continue to see many trends that began evolving at the end of 2023, namely stronger appreciation in markets that lagged in gains during the pandemic and a result remain relatively more affordable. In addition, continued pressure from pent-up demand will help keep prices moving up in most other markets.
Pent-up demand not only reflects younger Americans who are first-time buyers, but also those who have been sitting on the sidelines awaiting lower rates and more inventory. Also, the recent surge in immigration, which led to doubling of new U.S. residents, (from an average of 900,000 from 2010 to 2019 to 2.6 million in 2022 and 3.3 million in 2023), will put pressure on demand for all types of housing [1].
[1] Source: Congressional Budget Office: The Demographic Outlook: 2024 to 2054, https://www.cbo.gov/publication/59899
©2024 CoreLogic, Inc. All rights reserved. The CoreLogic content and information in this blog post may not be reproduced or used in any form without express accreditation to CoreLogic as the source of the content. While all of the content and information in this blog post is believed to be accurate, the content and information is provided “as is” with no guarantee, representation, or warranty, express or implied, of any kind including but not limited to as to the merchantability, non-infringement of intellectual property rights, completeness, accuracy, applicability, or fitness, in connection with the content or information or the products referenced and assumes no responsibility or liability whatsoever for the content or information or the products referenced or any reliance thereon. CoreLogic® and the CoreLogic logo are the trademarks of CoreLogic, Inc. or its affiliates or subsidiaries. Other trade names or trademarks referenced are the property of their respective owners.


