In January, 16 metro areas had stronger annual home price growth compared to December
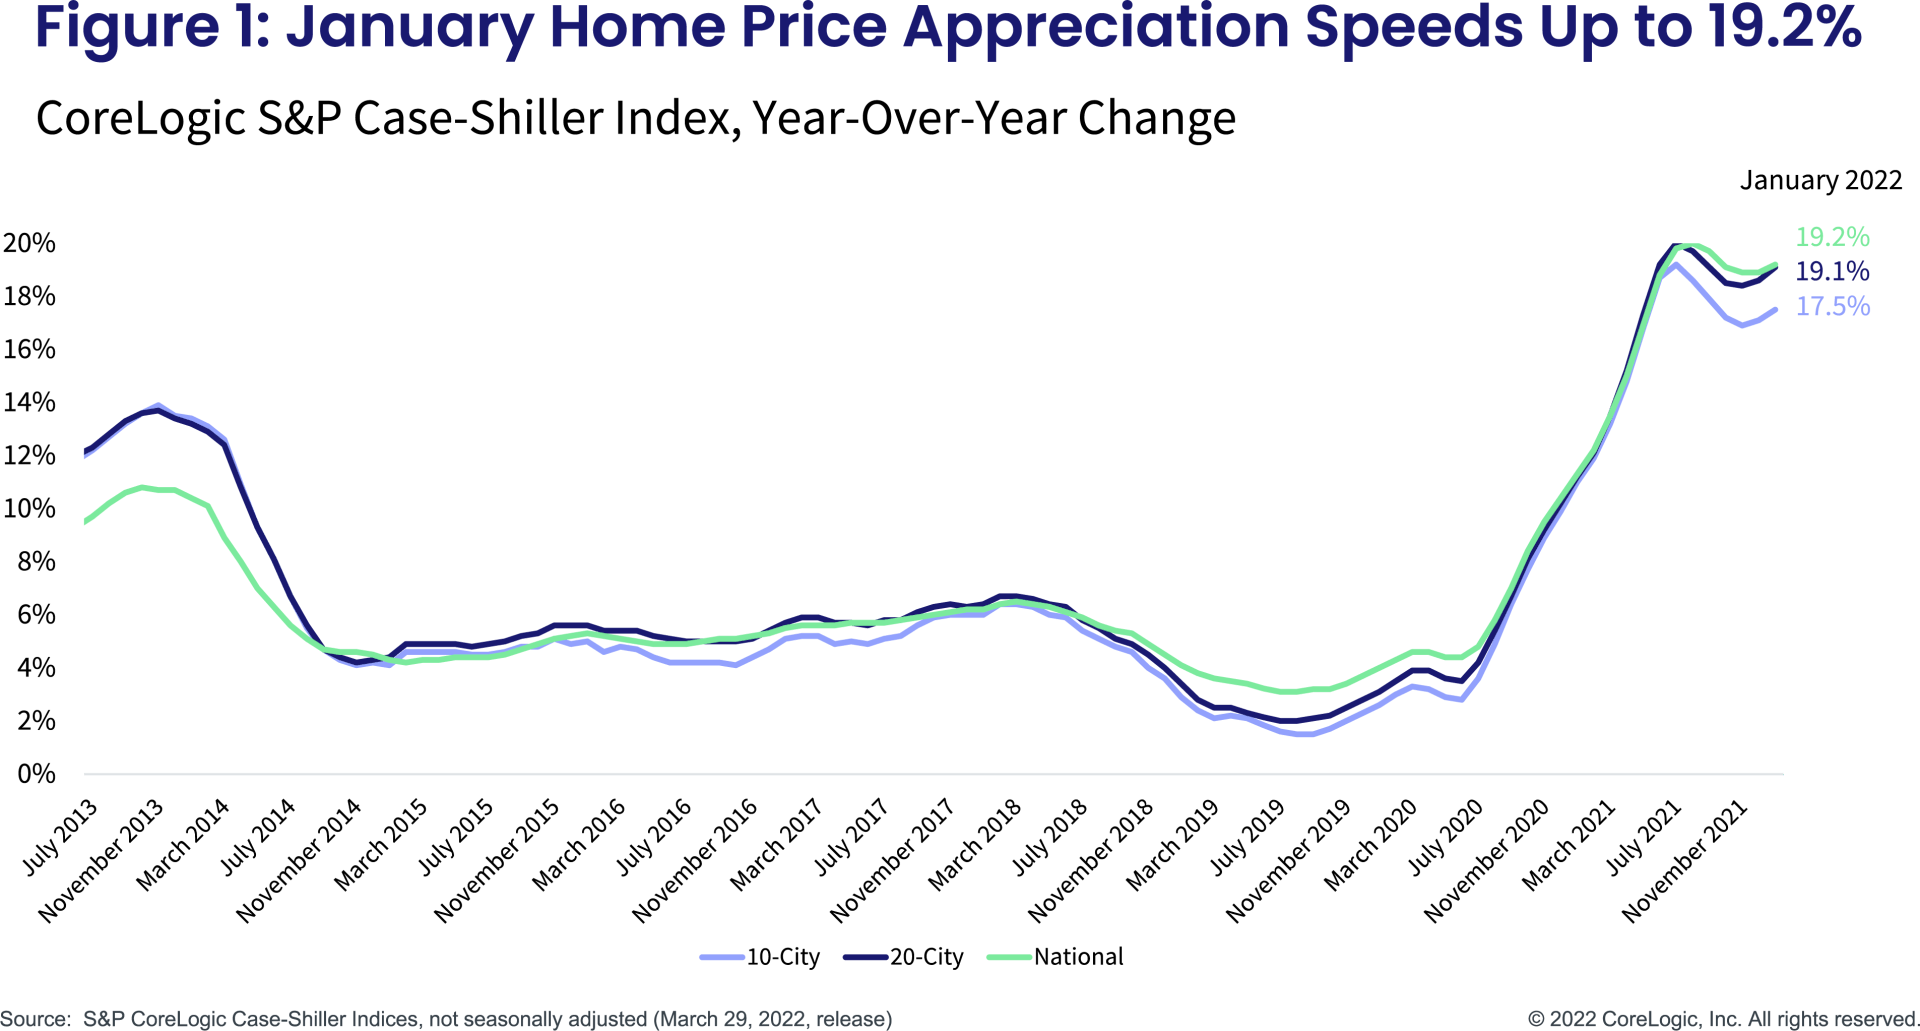
After a short respite, home price growth sped up in January. The S&P CoreLogic Case-Shiller Index registered a 19.2% increase after four months of slowing or flat growth. This was the strongest January year-over-year increase since the beginning of the data series.
The non-seasonally adjusted month-to-month index also increased 1.13% after a few months of flat and smaller increases. As with most of the monthly changes since last summer, January’s monthly increase was the largest in the data series. Between 2007 and 2020, the monthly Index changes from December to January were generally negative.
While the re-acceleration of home price gains may be concerning and likely discouraging for first-time and younger buyers, it is nevertheless unsurprising considering the dire inventory of for-sale homes, which continues to decline and continually record new lows. Additionally, with mortgage rates jumping to three-year highs, existing homeowners now have little incentive to sell and buy a new, more expensive home with a higher mortgage rate. As a result, homebuyers that remain in the market are once again faced with a very competitive buying environment. According to the CoreLogic MLS PIN data, after a winter lull, the share of homes that sold over the asking price has been climbing again and is now as high as during the last summer’s peak, with about 66% of homes selling over the asking price in March. This suggests that the CoreLogic Case-Shiller Index is unlikely to show a reprieve over the next few months.
The 10- and 20-city composite indexes also continued to regain pace from the prior four months of slowing and were up 17.5% and 19.1% year over year, respectively (Figure 1). The gains remained higher in the 20-city index. Since the onset of the pandemic, the demand for smaller, warmer and more affordable areas has been robust and bolstered by buyers in-migrating from more expensive areas. These buyers generally have higher incomes and larger budgets to bid on available homes.
Compared to the 2006 peak, the 10-city composite is now 33% higher, while the 20-city composite is 40% higher. Adjusted for inflation, which continues to be running hot and is likely to remain elevated throughout 2022, the 10-city index is down 2%, while the 20-city index is up 3% compared to the 2006 peak.

For the 31st consecutive month, Phoenix had the strongest home price growth among the 20 markets, surging 32.6% in January, up from December’s non-seasonally adjusted rate of 32.4%.
Tampa, Florida, still ranks second with a 30.8% gain, up from 29.4% the month before, while Miami ranks third with a 28.1% increase in January. While Tampa and Miami have been competing for the second-highest growing cities over the last year, January’s re-acceleration was the strongest in San Francisco, which gained a 2-percentage-point increase in annual gains since December. Tampa, Dallas and San Diego followed with smaller but still relatively strong re-acceleration in gains since December.
In sum, 16 metro areas experienced acceleration in annual gains since December.
Washington and Minneapolis are on the bottom of the year-over-year price growth list, up 11.2% and 11.8%, respectively. Despite having the slowest rate of annual price increases, these areas have still been experiencing double-digit rates for 14 consecutive months. The metros with the largest slowdown in annual gains from the month before are New York and Portland, Oregon (Figure 2).
Cumulatively, home prices are up 31% since March 2020, when the pandemic started. Given the strength in the Phoenix market for the past 31 months, and which started prior to the pandemic, the metro’s prices are now up 51% compared to March 2020, the highest among the 20 metros. Tampa follows with a 44% cumulative gain. In contrast, but in line with year-over-year trends observed in previous releases, Washington, Minneapolis and Chicago have had cumulative increases amounting to about 20%-21% (Figure 3).
Further, the average gains for all three price tiers also continued to re-accelerate in January, with the high tier showing most of the acceleration, up 21.4% in January from 20.6% in December. The slowest regain in price growth was among low-tier homes, still up 20.1%. The lagging price growth among the low tier reflects the affordability challenges that those looking to buy in this price range are facing after almost two years of vigorous price gains.
In addition, the month-to-month comparison of home price growth by price tier and location reveals where demand is slowing relatively faster. From December to January, areas with colder climates, particularly Minneapolis, continued with smaller monthly increases. For the second consecutive month, all metros had at least some gains across the price tiers. The largest monthly gains were in warmer areas and the West, such as San Diego, San Francisco and Seattle, as well as Tampa farther south. San Diego and San Francisco seem to have regained some excitement from buyers after a few months of slower gains, particularly among higher-priced homes.
The average monthly gains among low-tier homes sped up in January, up 1.2%, though these are not seasonally adjusted. The high-tier monthly gains averaged 1.5% in January — again, noting acceleration from December’s average of 1%. In the high-tier, San Diego led the monthly gains, up 2.7%, followed by Tampa and Seattle, both up 2.3%. The middle-tier monthly price increases averaged 1.4% (Figure 4).
While many expected the housing market to show signs of slowing during the first few months of the new year, there has actually been a re-acceleration in buyer exuberance. This leaves many wondering what’s in store for the housing market for the remainder of 2022.
Though widely anticipated, the inventory of for-sale homes unfortunately does not look promising for this spring’s homebuying season. According to CoreLogic MLS data, new listings of for-sale homes in March were on average 25% below 2019 levels, despite March generally being when new listings pick up pace for the upcoming spring homebuying season. With so few homes, buyers are once again left with fierce competition that’s driving the share of homes that sold over the listing price up to 66% – the same rate as summer 2021, when buyer competition last peaked.
While surging interest rates were expected to have a dampening effect on demand, there are still many buyers who can afford the rising costs of homeownership. Though it is encouraging to see the many U.S. consumers financially stronger than anticipated, there are unfortunately many potential homebuyers left behind who can no longer afford to compete.
With the continued imbalance between supply and demand, home prices are likely to have another year of strong gains and are expected to average about 10% growth for the year.


