The Application of Social Network Graph Analysis in Comparable Selection
An automated valuation model (AVM) provides an estimate of market value for the subject property at a specified point in time. Most AVM methodologies use comparable properties recently sold to value the subject property, identify all properties within a certain distance and then apply rules to find those that are most similar to the subject in terms of property characteristics and location factors.
We are all familiar with social networks such as Facebook and LinkedIn, in which people are connected by certain relationships. For example, you might be connected with your colleagues or someone you met at a conference, and the strength of a linkage depends upon how well you know your connections.
If we apply this concept to the housing market, it is possible to construct a network of properties – a network graph algorithm. Nodes on the graph represent individual properties, and the strength of each linkage indicates the similarity of connected properties. A linkage can also depend on factors beyond property characteristics—for example, if a property was used as a comparable sale by an appraiser for another property, it means they are like each other, so the linkage between them would be very strong.
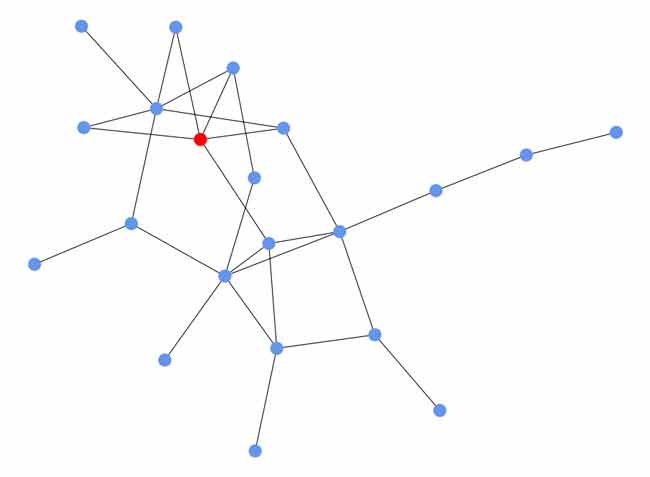
Once we have the network for all properties in the nation, the selection of comparable properties is straightforward: the best ones are those with the strongest linkage to the subject. Figure 1 shows a network graph that connects a subject (red node) and its comparables (blue nodes), all of which are linked directly or indirectly.

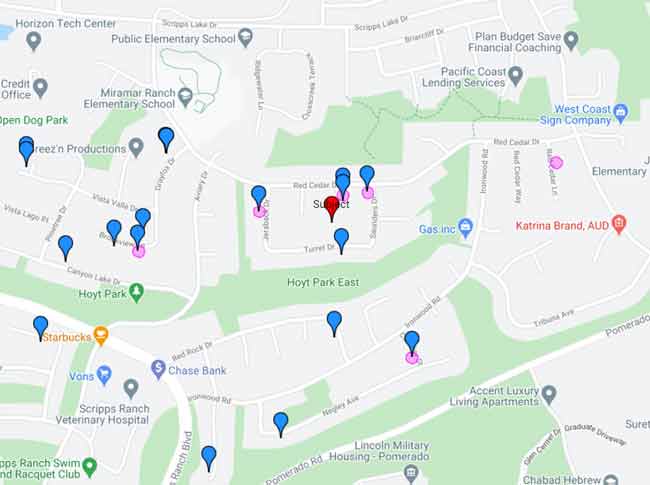
To better conceptualize, let us look at an example on Google Maps (Figure 2). The red pin is the subject property, pink circles are comparable properties previously used by an appraiser, and blue pins are ideal comparables identified by the network graph algorithm.

The first takeaway is the algorithm picks up all but one of the appraiser’s comparables. This is a great indicator of success as nobody knows the neighborhood better than a local appraiser. A close look at the comparable chosen by the appraiser but missed by the algorithm reveals it is a much smaller home (1,500 sqft) compared to the subject and other comparables (about 2,000 sqft), so the appraiser may have had a less obvious reason for including the smaller comparable. The second takeaway is comparables tend to be in the same neighborhood as the subject, or in the same neighborhoods as those previously selected by the appraiser.
If we look closer, the appraiser generally chose comparables from three neighborhoods on the map (top left, the middle and the bottom), and that is exactly where the algorithm goes to find comparable properties. We did not limit the algorithm to search only these three areas, but by analyzing the property network graph, the algorithm was able to figure out the best places to select comparables.
Leveraging a network graph algorithm is the next step in increasing the accuracy of an AVM, helping originators get a more accurate valuation of a property earlier in the lending process, removing uncertainty and creating stickiness with a borrower. A portion of this comparable selection algorithm is just one of the innovations driving our new Total Home ValueX™ AVM, announced in late 2020.
© 2021 CoreLogic, Inc. All rights reserved.


