Chat
Chat with Sales Hours: Monday-Friday 8:30 a.m. - 4:30 p.m. (CST)
Contact Sales
Call Sales Toll-Free 1-(866) 774-3282 Hours: Monday-Friday 7 a.m. - 5 p.m. (CST)
Product Login
Product Log-in
Product Support
Product Support
Email Sales
Contact Sales
After Hours
  • Support
  • Sign In Sign In
  • AUS NZ UK
CoreLogic - Home
  • Solutions
    view solutions by:

    Data Solutions

    • Lead Generation
    • Property Data
    • Location Intelligence

    Real Estate

    • Multiple Listing Enterprise
    • Agent & Broker

    Mortgage

    • Point of Sale
    • Origination
    • Servicing
    • Appraisal
    • Commercial Property Tax

    Insurance

    • Hazard Risk
    • Catastrophe Risk Management
    • Risk Evaluation
    • Underwriting Automation
    • Weather
    • Claims Automation
    • Restoration

    Mortgage Lenders

    • Point of Sale
    • Origination

    Mortgage Servicers

    • Residential Property Tax
    • Default & Loss Mitigation
    • Portfolio Insight & Monitoring

    Mortgage Appraisers

    • Appraisal

    Real Estate Agents & Brokers

    • Agents & Brokers

    Real Estate MLS

    • Multiple Listing Enterprises

    Commercial Real Estate Owners

    • Commercial Property Tax

    Marketing Departments

    • Property Data

    Insurance Underwriters

    • Risk Evaluation
    • Underwriting Automation
    • Hazard Risk
    • Catastrophe Risk Management

    Insurance Risk Managers

    • Risk Evaluation
    • Hazard Risk
    • Catastrophe Risk Management

    Insurance Claims

    • Claims Automation
    • Restoration Contractors
    • Weather Verification

    Construction Contractors

    • Restoration Contractors

    General

    • Location Intelligence
    • Lead Generation
    • Data Solutions
  • Resources

    Reports

    • Climate Change
    • Construction Claims Bulletin
    • Construction Cost Update
    • Construction Insights
    • Home Price Insights
    • Homeowner Equity Insights
    • Loan Performance Insight
    • Mortgage Fraud
    • Property Tax Delinquency
    • Single-Family Rent Index

    Insight Blogs

    • Hazard HQ
    • Office of Chief Economist
    • Affordable Housing
    • Homebuying
    • Insurance
    • Other Articles

    More Resources

    • Events
    • Case Studies
    • White Papers
    • Podcasts
    • Quick Takes
  • Company
    • About
    • Leadership
    • Newsroom
    • Contact
    • Careers
  • Search
CoreLogic - Home
  • Solutions
  • Resources
  • Company

    • About
    • Leadership
    • Newsroom
    • Contact
    • Careers
  • Accounts

    • Products Sign-in
  • Contact

    • Sales Contact
    • Product Support
  • Regions

    • Australia
    • New Zealand
    • United Kingdom
  • Social

    • Facebook
    • Instagram
    • Linkedin
    • Twitter
    • Youtube
Solutions
VIEW BY:
  • Data Solutions

    • Lead Generation
    • Property Data
    • Location Intelligence
  • Real Estate

    • Multiple Listing Enterprise
    • Agent & Broker
  • Mortgage

    • Point of Sale
    • Origination
    • Servicing
    • Appraisal
    • Commercial Property Tax
  • Insurance

    • Hazard Risk
    • Catastrophe Risk Management
    • Risk Evaluation
    • Underwriting Automation
    • Weather
    • Claims Automation
    • Restoration
  • Mortgage Lenders

    • Point of Sale
    • Origination
  • Mortgage Servicers

    • Residential Property Tax
    • Default & Loss Mitigation
    • Portfolio Insight & Monitoring
  • Mortgage Appraisers

    • Appraisal
  • Real Estate Agents & Brokers

    • Agents & Brokers
  • Real Estate MLS

    • Multiple Listing Enterprises
  • Commercial Real Estate Owners

    • Commercial Property Tax
  • Marketing Departments

    • Property Data
  • Insurance Underwriters

    • Risk Evaluation
    • Underwriting Automation
    • Hazard Risk
    • Catastrophe Risk Management
  • Insurance Risk Managers

    • Risk Evaluation
    • Hazard Risk
    • Catastrophe Risk Management
  • Insurance Claims

    • Claims Automation
    • Restoration Contractors
    • Weather Verification
  • Construction Contractors

    • Restoration Contractors
  • General

    • Location Intelligence
    • Lead Generation
    • Data Solutions
Resources
  • Reports

    • Climate Change
    • Construction Claims Bulletin
    • Construction Cost Update
    • Construction Insights
    • Home Price Insights
    • Homeowner Equity Insights
    • Loan Performance Insight
    • Mortgage Fraud
    • Property Tax Delinquency
    • Single-Family Rent Index
  • Insight Blogs

    • Hazard HQ
    • Office of Chief Economist
    • Affordable Housing
    • Homebuying
    • Insurance
    • Other Articles
  • More Resources

    • Events
    • Case Studies
    • White Papers
    • Podcasts
    • Quick Takes

Home / Intelligence / Residential Real Estate: Largest US Asset Class but Not Biggest Economic Driver

ABOUT THE AUTHOR
Thomas Malone
Thomas Malone
Professional, Economist
View Profile
  • June 16, 2023

Residential Real Estate: Largest US Asset Class but Not Biggest Economic Driver

The total value of U.S. residential real estate outpaces the Standard and Poor’s 500 and all publicly listed companies

The market cap of the Standard and Poor’s 500 sits at $36.7 trillion[1]. The total value of all U.S. public companies is $40 trillion. The U.S. residential real estate market, on the other hand, is worth $43.5 trillion. Clearly, much of the country’s wealth is concentrated in homes, making the real estate housing market the biggest asset class in the country and likely the world.

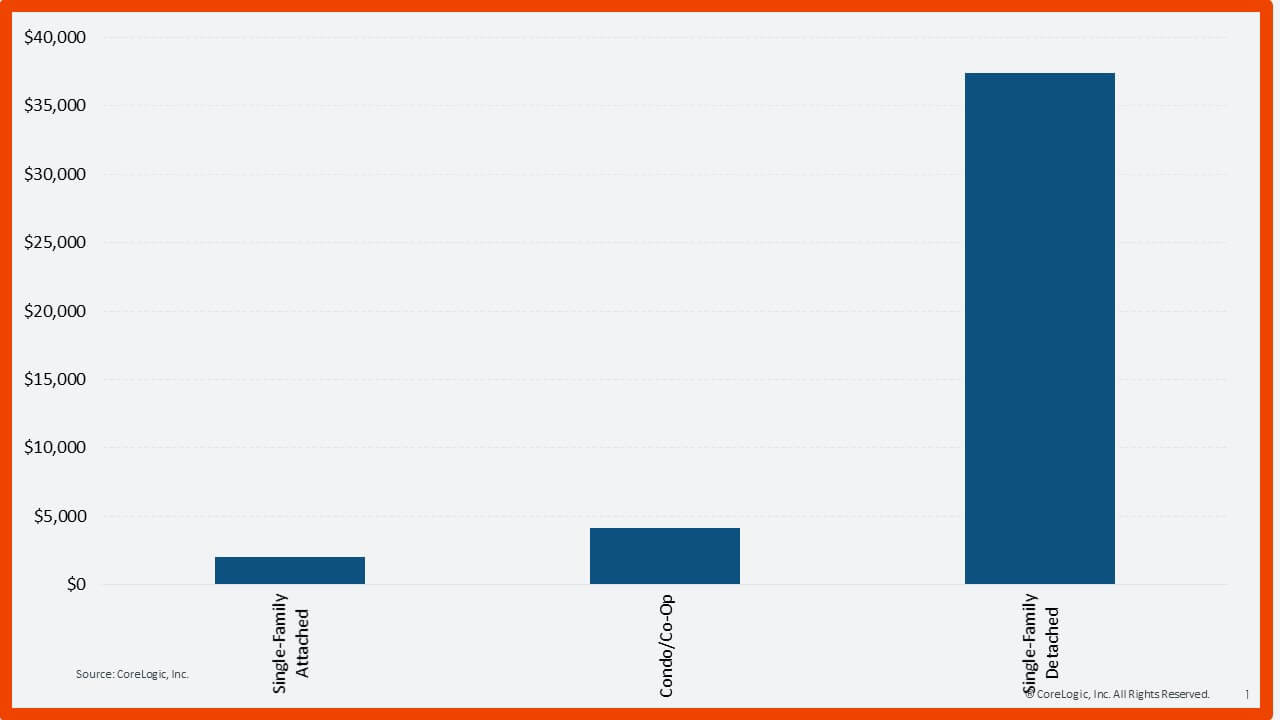
The total value of housing wealth can be measured by adding together the values of individual properties, according to CoreLogic’s Total Home ValueX solution [2], but it is worth noting that not all residential real estate types are equal, as most of the wealth lies in detached, single-family homes. CoreLogic estimates the total value of these single-family homes to be $37.4 trillion. The total value of condos in the U.S. is substantially less, valued at $4.1 trillion. Attached single-family homes have a value of $2 trillion [3].

This disparity in value is due in part to the fact that there are approximately 10 times more single-family homes than condos and townhomes. However, the substantially larger proportion of wealth housed in single-family properties reflects the fact that the value of real estate is primarily in land rather than in structures.

Figure 1: Total Value by Property Type ($B)

Source: CoreLogic Total Home ValueX AVM.
© 2023 CoreLogic,Inc., All rights reserved.

The trajectory of total housing value follows a similar path to home prices. Housing values rose by 11% from 2020 to 2021 and 18% from 2021 to 2022. Values have since fallen by 4%. Similarly, the latest U.S. S&P CoreLogic Case-Shiller Index showed a 3.7% decrease from its 2022 peak.

These two metrics will continue to follow a similar path since the number of existing homes is much larger than the number of new homes [4], and this relationship brings a new perspective to the importance of price indexes in the real estate market. Should home prices increase by 1.2%, as they did from March to April of 2023, then an additional $522 billion in wealth will be created.

Figure 2: Total Value of U.S. Residential Real Estate, 2013-2023 ($B)

Source: CoreLogic Total Home ValueX AVM
© 2023 CoreLogic,Inc., All rights reserved.

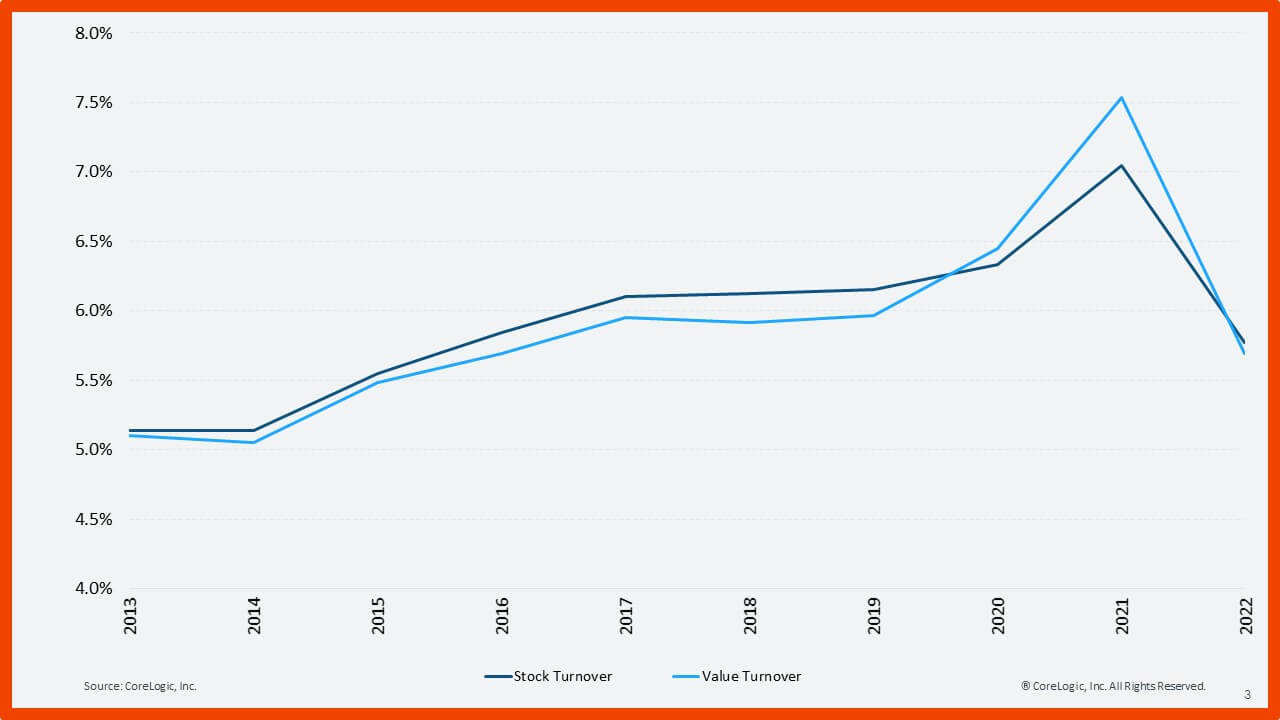
Turnover is a statistic that is typically reported as the share of homes sold in a year. However, it can also be measured as the share of the total housing value that turned over. Figure 3 shows both statistics from 2012 to 2022 [5]. Although both metrics align closely, there are some deviations. Value turnover was the lowest of the two metrics from 2013 to 2019, but it surpassed stock turnover in 2020 and 2021 before declining again in 2022. This pattern is due to the market trends of the past several years when higher-priced homes made up a larger proportion of sales during the pandemic before buyer preferences shifted toward smaller homes in more affordable locations.

Figure 3: Turnover in Residential Real Estate, 2013-2022

Source: CoreLogic Total Home ValueX AVM and CoreLogic Public Records
© 2023 CoreLogic,Inc., All rights reserved.

Housing is where most of America’s wealth is stored, making it one of the primary drivers behind increases in individual net worth. In fact, the value of the U.S. residential real estate market has increased by $19 trillion since 2013. That figure is $4 trillion more than the value of all publicly traded companies in the U.S.

Estimates of how much a person or household actually consumes out of their wealth vary widely. Research has found that typically every $1 increase in housing wealth translates to between 2 and 7 cents of additional spending [6]. Combine this with the $19 trillion increase in housing value, and real estate wealth increases will likely lead to between $380 billion and $1.33 trillion in additional economic consumption.

Of course, this is a nominal figure in the context of the greater economy, which is why most research has found that the housing market is not a substantial contributor to economic output [7]. Furthermore, while we typically view increases in housing wealth as an asset, it also presents a liability for future homebuyers, so in that sense, the wealth increase is offset.

Nevertheless, housing wealth is still an important metric and is key to the health of the mortgage market. It can be tapped for additional resources such as home equity lines of credit or cash-out refinances, but housing values are also an important consideration in calculating owner equity, making it an important cushion against mortgage defaults.

However, much of this wealth will sit untapped. Most owners are currently locked in at very low mortgage rates, so will not liquidate (either by selling or refinancing) their equity to realize the gains. This makes these changes in value — and their resulting effects on the larger economy — somewhat hypothetical.


Footnotes

[1] All numbers listed are current as of April 28, 2023

[2] The value of an individual property was derived using CoreLogic’s Total Home ValueX AVM (specifically the risk management version of the model).

[3] Attached homes include townhomes, duplexes, triplexes and quadplexes.

[4] The total value of homes is the number of homes multiplied by the average value of those homes. The number of homes in the U.S. is well over 100 million, and new construction typically ranges between $600,000-$800,000.

[5] The year 2023 is excluded because we are less than half of the way through the year, but data indicates that turnover is low compared with this time in previous years.

[6] Painter, G., Yang, X., & Zhong, N. (2022). Housing wealth as precautionary saving: Evidence from urban China. Journal of Financial and Quantitative Analysis, 57(2), 761-789.

[7] Edward E. Leamer, 2007. “Housing is the Business Cycle,” Proceedings – Economic Policy Symposium – Jackson Hole, Federal Reserve Bank of Kansas City, 149-233

© 2023 CoreLogic,Inc., All rights reserved.
  • Category: Blogs, Intelligence, Mortgage, Office of the Chief Economist, Real Estate
  • Tags: Housing Market, Market Trends, Overall Housing Economy
ABOUT THE AUTHOR
Thomas Malone
Thomas Malone
Professional, Economist
View Profile

Related Posts

Extensive series of a Caucasian Real Estate Agent and African-American Couple in front of a home.
Core Conversations

Why the US Mortgage System Is a Shield From Inflation

Core Conversations explores the effects of inflation on housing prices, drawing connections to global trends.

November 15, 2023
Affordable Housing

Where Are the Most and Least Affordable US Single-Family Rental Markets?

Households in some U.S. markets pay almost 60% of their incomes toward rent, while those in others spend less than 25%.

November 14, 2023
Blogs

Why Banks Must Understand Climate-Related Financial Risk

As our climate continues to change, climate risk assessments will become increasingly critical to the financial stability of banks and financial institutions.

November 10, 2023

About Corelogic

  • Newsroom
  • Leadership
  • Careers
  • Ethics & Compliance

Accounts

  • Products Sign-in

Contact

  • Sales Contact
  • Product Support

Regions

  • CoreLogic Australia
  • CoreLogic New Zealand
  • CoreLogic UK

Follow & Connect

  • Facebook
  • Instagram
  • Linkedin
  • X (Formerly Twitter)
  • YouTube
© 2023 CoreLogic. All rights reserved.
  • Legal
  • Privacy Policy
  • CCPA
  • Cookie Preferences
  • Security
  • Sitemap
  • Accessibility
  • Legal
  • Privacy Policy
  • CCPA
  • Cookie Preferences
  • Security
  • Sitemap
  • Accessibility