360 Property Data
CoreLogic powers businesses with unrivaled property data, insights and technology.
Explore Our DataCoreLogic powers businesses with unrivaled property data, insights and technology.
Explore Our DataDifferentiate with insights and analysis from CoreLogic property data.
Know MoreProperty. People. Potential. CoreLogic unlocks value for the entire property ecosystem.
Learn More| United States | Canada | |||
| Quarter | Year | Quarter | Year | |
| Aluminum Conduit | 2.1% | 4.2% | 0.0% | 1.7% |
| Asphalt Shingles | 0.1% | 1.9% | -0.2% | 0.4% |
| Concrete Block | -0.4% | 1.5% | 0.1% | 1.8% |
| Drywall | -0.1% | 0.4% | 0.4% | 1.1% |
| Felt Paper | 0.1% | 0.9% | 0.4% | 3.0% |
| Galvanized Pipe | 0.0% | 1.4% | 1.5% | 6.3% |
| Lumber | 5.2% | 46.7% | 11.7% | 70.0% |
| Plywood | 5.3% | 35.0% | 11.2% | 32.2% |
| Ready Mix | 0.6% | 3.5% | 2.0% | 8.4% |
| Rebar | 0.6% | 1.0% | 0.2% | -1.2% |
| Steel Deck | 0.6% | 2.1% | 0.4% | 3.7% |
| Steel Stud | 0.4% | 2.5% | 0.4% | 3.0% |
| Structural Steel | 0.6% | 0.0% | 0.3% | 1.4% |
| 1/2″ Copper Pipe | 1.0% | 0.7% | 0.2% | 2.6% |
| National Average | Commercial | Agricultural |
| United States | 1.6% | 1.4% |
| Canada | 1.2% | 1.1% |
| US Quarterly Material Cost Changes | ||||||||||
| 4Q18 | 1Q19 | 2Q19 | 3Q19 | 4Q19 | 1Q20 | 2Q20 | 3Q20 | 4Q20 | 1Q21 | |
| Aluminum Conduit | 1.0 | 1.7 | 1.4 | 0.1 | 0.6 | 0.6 | 1.0 | -1.0 | 2.0 | 2.1 |
| Concrete Block | 0.2 | 0.8 | 1.1 | 0.4 | 0.8 | 1.0 | 0.7 | 0.6 | 0.7 | -0.4 |
| Drywall | 1.2 | -0.3 | -0.1 | 0.3 | 0.7 | -0.5 | -0.1 | 0.0 | 0.7 | -0.1 |
| Galvanized Pipe | 1.9 | 1.9 | 1.1 | 0.8 | 0.5 | 0.5 | 0.5 | 0.6 | 0.3 | 0.0 |
| Ready Mix | 0.1 | 0.3 | 1.6 | 1.5 | 0.9 | 0.7 | 1.0 | 0.2 | 1.7 | 0.6 |
| Rebar | 1.4 | 0.6 | -0.4 | 0.5 | -0.1 | 0.8 | -0.1 | 0.4 | 0.1 | 0.6 |
| Steel Deck | 1.7 | 1.0 | 0.5 | -0.3 | 0.0 | 0.4 | 0.6 | 0.1 | 0.8 | 0.6 |
| Steel Stud | 2.4 | 1.0 | -0.6 | 0.1 | 1.5 | 0.2 | 0.6 | 0.6 | 0.8 | 0.4 |
| Structural Steel | 1.1 | -0.1 | -0.5 | -1.3 | -0.8 | -0.3 | -0.8 | -0.1 | 0.3 | 0.6 |
| ½” Cooper Pipe | -1.1 | -1.0 | 0.1 | -0.3 | -1.4 | -0.4 | -0.4 | -0.3 | 0.3 | 1.0 |
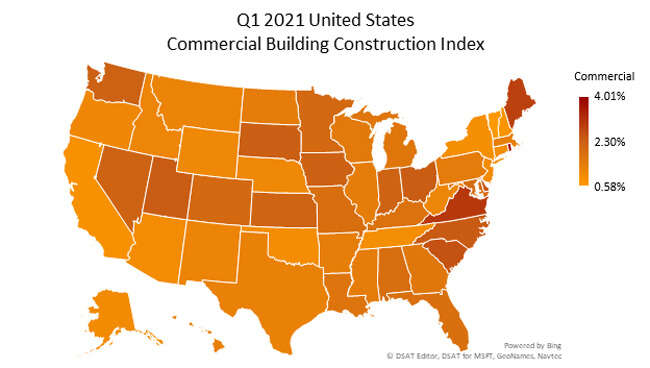
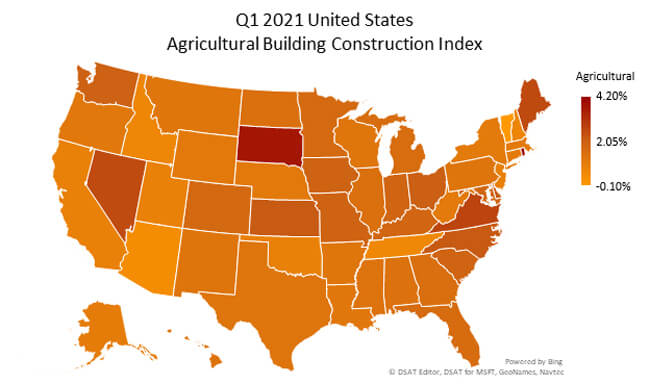
| State | Commercial | Agricultural |
| Alabama | 1.87% | 1.34% |
| Arizona | 0.97% | 0.35% |
| Arkansas | 1.38% | 1.19% |
| California | 0.82% | 0.79% |
| Colorado | 2.01% | 1.69% |
| Connecticut | 0.93% | 1.05% |
| Delaware | 2.46% | 2.10% |
| District Of Columbia | 0.62% | 1.20% |
| Florida | 1.81% | 1.57% |
| Georgia | 1.59% | 1.48% |
| Idaho | 1.17% | 0.60% |
| Illinois | 1.42% | 1.42% |
| Indiana | 2.18% | 1.86% |
| Iowa | 2.24% | 1.93% |
| Kansas | 2.16% | 2.15% |
| Kentucky | 1.75% | 1.80% |
| Louisiana | 1.67% | 1.15% |
| Maine | 2.84% | 2.53% |
| Maryland | 1.90% | 1.82% |
| Massachusetts | 1.34% | 1.05% |
| Michigan | 1.63% | 1.53% |
| Minnesota | 2.00% | 1.67% |
| Mississippi | 1.43% | 1.30% |
| Missouri | 1.86% | 1.90% |
| Montana | 1.21% | 1.19% |
| Nebraska | 1.08% | 1.07% |
| Nevada | 2.20% | 2.51% |
| New Hampshire | 0.73% | 0.63% |
| New Jersey | 1.00% | 0.81% |
| New Mexico | 1.19% | 1.23% |
| New York | 0.88% | 1.03% |
| North Carolina | 2.38% | 2.18% |
| North Dakota | 1.43% | 1.42% |
| Ohio | 2.34% | 2.02% |
| Oklahoma | 0.93% | 0.78% |
| Oregon | 1.10% | 1.12% |
| Pennsylvania | 1.44% | 1.23% |
| Rhode Island | 4.01% | 4.20% |
| South Carolina | 2.53% | 1.87% |
| South Dakota | 2.30% | 3.69% |
| Tennessee | 0.91% | 0.54% |
| Texas | 1.30% | 1.25% |
| Utah | 2.35% | 0.80% |
| Vermont | 0.58% | -0.10% |
| Virginia | 3.00% | 2.67% |
| Washington | 2.23% | 1.96% |
| West Virginia | 1.15% | 1.05% |
| Wisconsin | 1.51% | 1.20% |
| Wyoming | 1.08% | 1.09% |
| Alaska | 0.98% | 0.97% |
| Hawaii | 1.31% | 1.30% |


| Canada Quarterly Material Cost Changes | ||||||||||
| 4Q18 | 1Q19 | 2Q19 | 3Q19 | 4Q19 | 1Q20 | 2Q20 | 3Q20 | 4Q20 | 1Q21 | |
| Aluminum Conduit | -0.5 | 1.6 | 1.8 | 1.9 | 1.5 | 0.8 | 1.1 | 0.1 | 0.6 | 0.0 |
| Concrete Block | 0.7 | 0.3 | 2.1 | 1.1 | 0.7 | 0.7 | 0.4 | 0.1 | 1.1 | 0.1 |
| Drywall | 1.1 | 2.1 | 2.0 | 1.2 | 0.8 | 0.3 | 0.1 | 0.2 | 0.4 | 0.4 |
| Galvanized Pipe | -0.3 | 0.5 | 1.9 | 1.2 | 1.9 | 1.6 | 1.6 | 1.3 | 1.7 | 1.5 |
| Ready Mix | -0.1 | 0.7 | 2.4 | 0.8 | 1.1 | 0.0 | 2.2 | 1.5 | 2.5 | 2.0 |
| Rebar | 1.2 | 0.1 | -0.7 | -1.6 | -1.6 | -0.6 | -1.1 | 0.2 | -0.5 | 0.2 |
| Steel Deck | 0.3 | 0.1 | 1.1 | 0.9 | 0.8 | 1.7 | 0.8 | 1.1 | 1.4 | 0.2 |
| Steel Stud | 2.0 | 2.4 | 2.0 | 1.1 | 0.7 | 0.9 | 0.9 | 1.0 | 0.8 | 0.4 |
| Structural Steel | 0.9 | 0.8 | -0.6 | 0.8 | 0.3 | 0.5 | 0.6 | 0.3 | 0.2 | 0.4 |
| ½” Cooper Pipe | 0.0 | 1.8 | 2.2 | 0.4 | 1.0 | 1.8 | 1.5 | 0.4 | 0.5 | 0.2 |
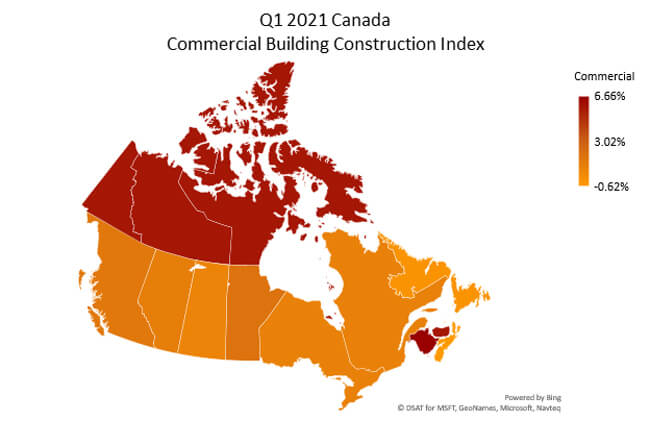
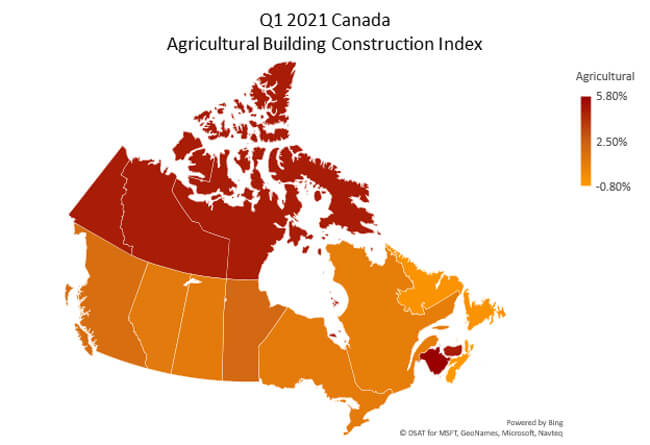
| Province | Commercial | Agriculture |
| Alberta | 1.13% | 1.02% |
| British Columbia | 1.49% | 1.71% |
| Manitoba | 1.81% | 1.98% |
| New Brunswick | 6.66% | 5.80% |
| Nova Scotia | -0.62% | -0.80% |
| Ontario | 0.94% | 0.91% |
| Quebec | 0.94% | 0.76% |
| Saskatchewan | 0.72% | 1.00% |
| Newfoundland & Labrador | 0.25% | -0.46% |
| Prince Edward Island | 5.78% | 4.80% |

